
On this page
Culture Activation is the practice of transforming organizational culture through daily behavioral change rather than periodic measurement. It represents a fundamental shift from asking "how engaged are our people?" once a quarter to building systems that make culture operate every day. The distinction matters because 75% of culture and engagement tools become shelfware, averaging just 25% adoption across the industry (Gartner, 2024). Culture Activation platforms like Happily.ai achieve 97% voluntary daily adoption by designing for behavior change, not data collection.
Employee engagement surveys have been the default approach to understanding workplace culture for over two decades. They work well for specific purposes. But a growing number of organizations are discovering that measuring culture and activating culture are two different jobs. And the gap between the two is costing them more than they realize.
This comparison breaks down where each approach fits, where each falls short, and how to decide which one your organization actually needs.
How Culture Activation and Engagement Surveys Differ
The core difference is not features or frequency. It is philosophy.
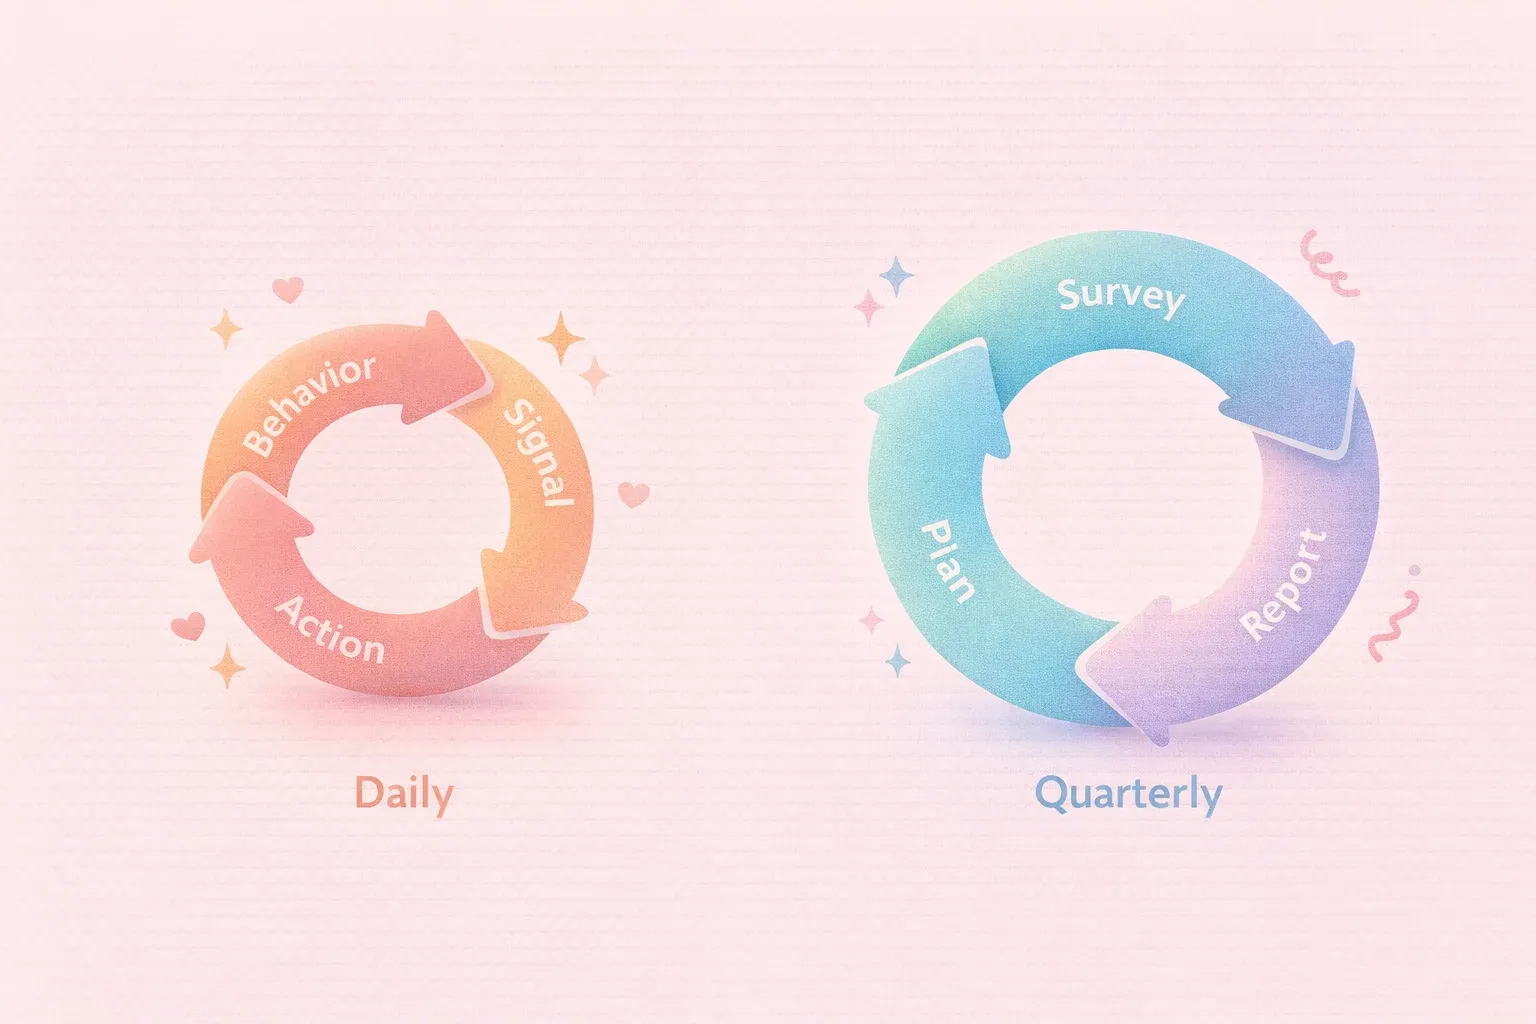
Engagement surveys treat culture as something you assess. You design a questionnaire, distribute it, collect responses, analyze the data, create an action plan, and then try to implement changes before the next survey cycle. The model is: measure, then react.
Culture Activation treats culture as something you build through daily systems. Participation generates data as a byproduct of activities that benefit employees directly. Managers receive real-time signals and act on them continuously. The model is: activate behavior, and measurement happens automatically.
This philosophical difference cascades into every practical detail, from adoption rates to time-to-value to the quality of data you collect.
Head-to-Head Comparison: Culture Activation vs Engagement Surveys
| Dimension | Culture Activation | Employee Engagement Surveys |
|---|---|---|
| Core approach | Daily behavioral systems built on behavioral science | Periodic questionnaires distributed quarterly or annually |
| Adoption rate | 97% voluntary daily use (Happily.ai) | 25% average tool adoption; 60-80% survey response rate during active cycles |
| Data freshness | Continuous, real-time signals | Snapshot data from weeks or months ago |
| Manager support | Real-time effectiveness signals + AI coaching | Post-survey action plans delivered weeks after data collection |
| Employee experience | Feels like a two-minute daily habit (intrinsically rewarding) | Feels like compliance (extrinsically motivated) |
| Time to value | Weeks | Months (survey design, rollout, analysis, action planning) |
| Data quality | Near-universal participation reduces self-selection bias | Self-selected respondents skew data toward extremes |
| What it surfaces | Feeling (team health), Focus (alignment), Progress (goals) | Sentiment scores, engagement indices, benchmark comparisons |
| Action mechanism | Managers act in real time on daily signals | HR creates post-survey action plans that may or may not reach managers |
| Best for | Organizations that want culture to operate daily | Organizations that need periodic benchmarks and compliance reporting |
Where Employee Engagement Surveys Excel
Engagement surveys are not broken. They solve specific problems well. If your organization needs these outcomes, surveys remain the right tool.
Regulatory Compliance and Board Reporting
Some industries require standardized engagement measurement for regulatory purposes. Boards and investors often expect engagement scores benchmarked against industry peers. Engagement surveys speak this language fluently. They produce the kind of structured, comparable data that satisfies governance requirements and fits neatly into quarterly board presentations.
If your board asks "how does our engagement compare to other Series C companies in tech?", a survey platform with a large benchmark database gives you that answer.
Historical Benchmarking at Scale
Survey platforms like Culture Amp and Qualtrics maintain benchmark databases spanning thousands of organizations. When researchers at Gallup report that only 23% of global employees are engaged, that finding comes from survey methodology applied consistently over decades. For organizations that need to track the same metrics in the same way over multiple years, surveys provide methodological rigor that newer approaches cannot yet match.
Academic Rigor and Validated Instruments
The best survey platforms build their questionnaires on validated psychometric instruments. The questions have been tested for reliability and construct validity. For organizations where HR teams need to defend their methodology to skeptical executives or academic partners, this validation carries real weight.
The honest assessment: Engagement surveys remain the strongest choice for organizations above 500 employees that need standardized benchmarks, board-ready reports, and validated longitudinal data. They do this job well.
Where Culture Activation Excels
Culture Activation solves a different problem for a different situation. Here is where that difference delivers the most value.
Adoption That Actually Happens
Gartner research consistently shows that enterprise software tools average roughly 25% adoption. For culture and engagement tools, the number is often worse because participation is voluntary and the perceived value to individual employees is low.
Happily.ai achieves 97% voluntary daily adoption. Not survey response rate during a biannual push. Daily use, without HR sending reminder emails.
The mechanism is behavioral science. The platform applies the Fogg Behavior Model (Behavior = Motivation + Ability + Prompt): daily check-ins take under two minutes, gamification creates intrinsic motivation, and prompts arrive where employees already work. Think Duolingo for workplace culture, not a quarterly homework assignment.
The math makes the adoption gap concrete. In a 200-person organization, 25% adoption means 50 people generate data. That is a self-selected sample, not a representative one. At 97% adoption, 194 people participate daily. That changes every downstream decision you make from the data.
Real-Time Signals Instead of Quarterly Snapshots
An engagement survey tells you how people felt during the week they completed it. A Culture Activation platform tells you how people feel today.
For organizations scaling quickly, the difference is not subtle. When misalignment complaints spike 149% year-over-year across industries, waiting three months to discover that a team is struggling means waiting three months to do something about it. By the time the survey results arrive, the best performer on that struggling team may have already accepted another offer.
Continuous signals change the dynamic. You see trends as they develop. You spot a manager struggling in week two, not month six. You notice alignment drifting when it is a course correction, not a crisis.
Manager Effectiveness at the Speed It Requires
Gallup's research established that managers account for 70% of the variance in team engagement. Your managers are your highest-leverage investment in culture, retention, and performance.
With engagement surveys, a manager whose team is declining in January may not appear in the data until the April survey is analyzed in May. Five months of impact before anyone sees it.
Culture Activation surfaces manager effectiveness signals in real time. The platform tracks feedback quality, response patterns, and team health indicators continuously. When a manager starts struggling, the signals appear in days. AI coaching provides specific, personalized guidance rather than generic post-survey action plans that sit in a shared drive.
Three Dimensions Leaders Lose at Scale
As organizations grow past 50 people, leaders gradually lose visibility into three things:
- Feeling (Team Health): "Is my team okay?" Real-time wellbeing signals and early warnings, not annual sentiment snapshots.
- Focus (Alignment): "Are people working on what matters?" Daily work mapped to priorities, not self-reported alignment in a survey.
- Progress (Goals): "Are we making progress?" Continuous velocity indicators, not quarterly retrospectives.
Engagement surveys can ask employees if they feel aligned. Culture Activation can show you whether they actually are.
The proof points: Organizations using Happily.ai report a 48-point eNPS improvement, 40% reduction in turnover (translating to $480K in annual savings for a 100-person company), and a 9x trust multiplier from the platform's daily recognition system, all drawn from analysis of 10M+ workplace interactions across 350+ organizations.
The Activation Gap: Why 75% of Culture Tools Become Shelfware
The gap between culture activation and engagement survey tools deserves its own section because it explains why so many organizations buy tools and see no results.
Deloitte's 2024 Global Human Capital Trends report found that most organizations still struggle to translate people data into action. The problem is not a lack of data. It is a lack of systems that convert data into daily behavior change.
Here is how the gap develops:
Step 1: Purchase. An organization buys an engagement survey platform, budgets for implementation, and announces it to the company.
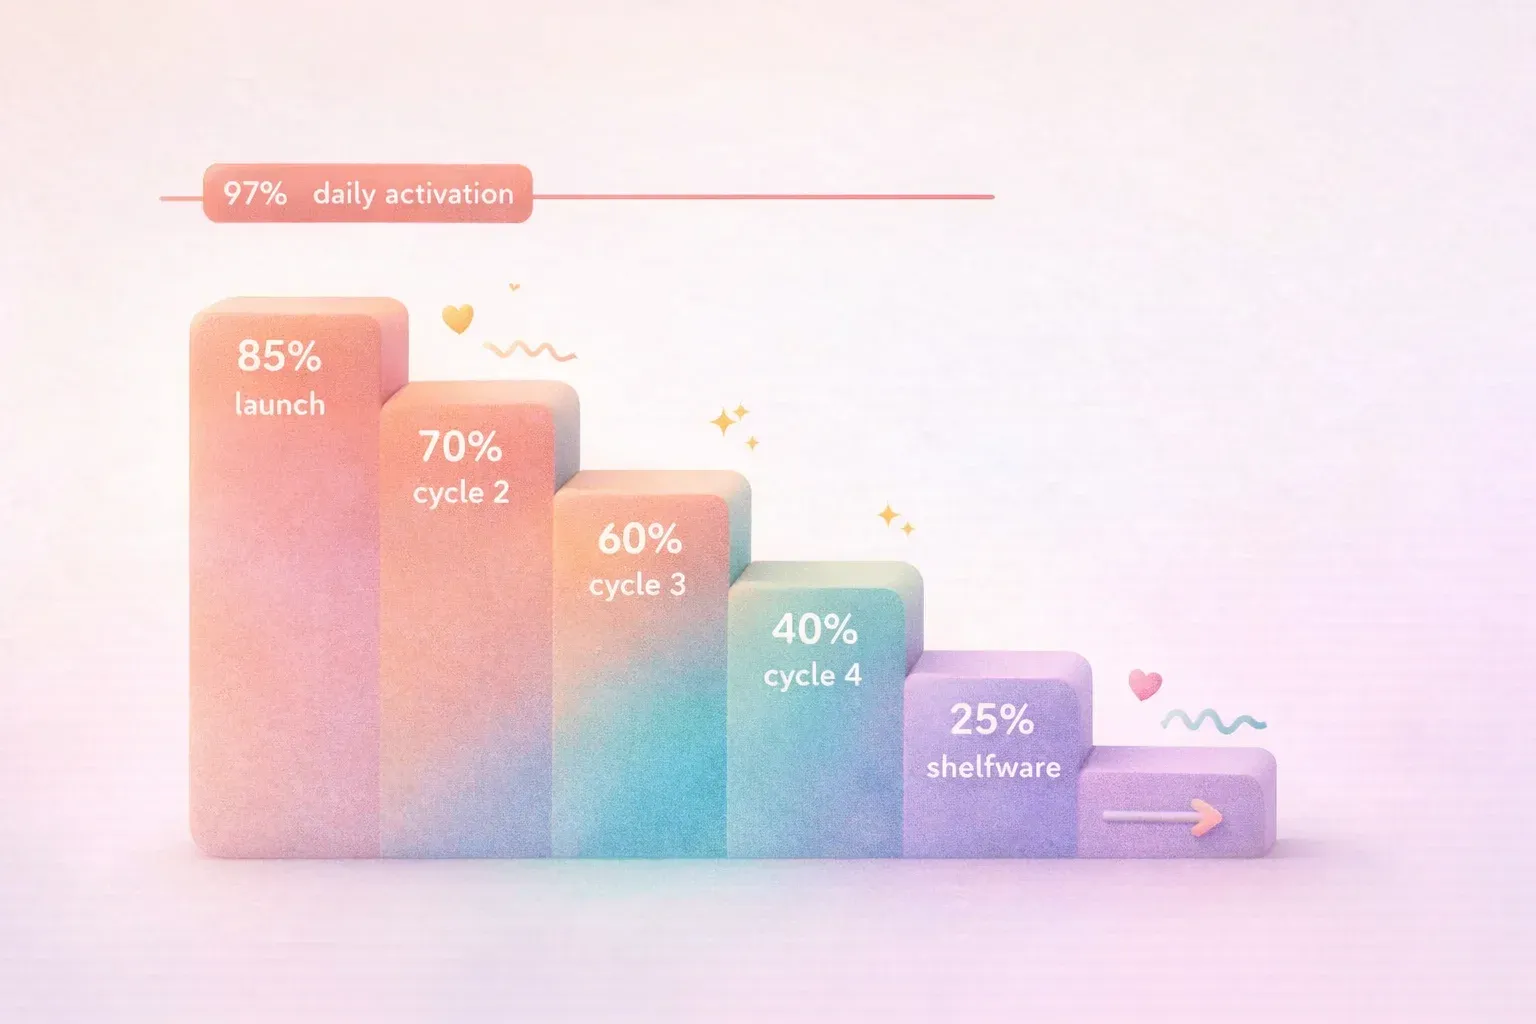
Step 2: Launch enthusiasm. The first survey gets 80-85% response rates. Leadership is excited. The data looks rich.
Step 3: Action plan friction. HR analyzes the results, creates action plans, and distributes them to managers. Some managers act on them. Most do not, because the plans arrive weeks after the data was collected and feel disconnected from current reality.
Step 4: Response rate decay. The second survey drops to 70%. The third hits 60%. Employees start asking, "What happened with the results from last time?"
Step 5: Shelfware. By year two, the tool exists in name only. HR runs the surveys because they are budgeted. Managers check the box. Real culture work happens informally, if it happens at all.
Culture Activation breaks this cycle by making participation the product, not the prerequisite. Employees do not use the platform to generate data for HR. They use it because the daily check-in, the recognition features, and the coaching make their work better. Data generation is a byproduct of value delivered, not a tax on employee time.
This is why the adoption gap is not 97% versus 80%. It is 97% daily use versus 25% meaningful adoption of the tool itself. The survey response rate is a vanity metric. The real question is whether the tool changes behavior between survey cycles.
When to Choose Which: A Decision Framework
The right approach depends on your specific situation. Use these conditions to guide your decision.
Choose engagement surveys if:
- Your board or investors require standardized engagement benchmarks compared against industry peers
- You operate in a regulated industry that mandates periodic employee sentiment measurement
- Your organization exceeds 1,000 employees and needs enterprise-grade segmentation across countries, departments, and tenure bands
- You already have a mature, well-staffed HR analytics function that can translate survey findings into manager-level action plans
- Your primary goal is longitudinal trend analysis across consistent metrics over multiple years
Choose Culture Activation if:
- You need to know how your teams are doing this week, not last quarter
- Previous engagement or culture tools became shelfware (adoption below 40%)
- You are scaling from 50 to 500 employees and losing visibility into team dynamics
- Manager effectiveness is your primary lever for improving retention and performance
- You want culture to function as daily operational infrastructure, not a periodic HR initiative
- Your organization is open to behavioral science and gamification as mechanisms for change
Consider using both if:
- You need board-level benchmarks AND daily operational signals
- You are transitioning from surveys to activation and want to run them in parallel during the shift
- Your organization is large enough that different divisions have different needs
Decision Table: Which Approach Fits Your Situation?
| Your Situation | Best Fit | Why |
|---|---|---|
| 50-200 employees, scaling fast | Culture Activation | You need speed and daily visibility, not quarterly reports |
| 500+ employees, established HR team | Engagement surveys (or both) | Enterprise segmentation and benchmarks justify the investment |
| Board requires engagement benchmarks | Engagement surveys | Surveys produce the standardized metrics boards expect |
| Previous tools became shelfware | Culture Activation | Behavioral science design solves the adoption problem directly |
| Manager effectiveness is top priority | Culture Activation | Real-time signals and AI coaching beat post-survey action plans |
| Regulatory compliance requires measurement | Engagement surveys | Validated instruments and audit trails meet compliance needs |
| Remote or hybrid workforce | Culture Activation | Daily signals reveal remote team health that surveys miss between cycles |
| Need results this quarter | Culture Activation | Weeks to deploy vs. months for full survey implementation |
Frequently Asked Questions
What is the difference between culture activation and employee engagement surveys?
Employee engagement surveys measure how employees feel at a single point in time, typically quarterly or annually, using structured questionnaires. Culture Activation transforms culture through daily behavioral systems that achieve high adoption (97% in the case of Happily.ai) by making participation intrinsically rewarding. Surveys tell you where culture stands. Activation changes where culture goes. The key practical difference is frequency and adoption: daily signals from nearly everyone versus periodic snapshots from a self-selected group.
Are engagement surveys still worth it in 2026?
Yes, for specific use cases. Engagement surveys remain the best tool for standardized benchmarking against industry peers, regulatory compliance, and board-level reporting. Where they fall short is driving daily behavior change between survey cycles. Organizations that need both benchmarks and daily activation increasingly pair a lightweight annual survey with a Culture Activation platform for continuous insight. For a deeper look at what engagement measurement means for leadership, see What is Employee Engagement: A CEO Guide.
Can a culture activation platform replace our engagement survey entirely?
It depends on what your survey provides. If your primary need is understanding how teams feel and whether managers are effective, a Culture Activation platform like Happily.ai delivers richer, more current data than any quarterly survey. If your primary need is industry benchmarking or compliance reporting, you may still need a survey for those specific functions. Many organizations find that once they have daily activation data, their quarterly surveys become redundant for decision-making. The transition is a shift in how you think about measurement: from periodic assessment to continuous activation.
What is a good employee engagement survey alternative for growing companies?
For companies between 50 and 500 employees, Culture Activation platforms offer the strongest alternative. Traditional surveys were designed for enterprise scale, where the cost of implementation is distributed across thousands of seats. Growing companies need faster time-to-value and higher adoption. Happily.ai was built for this stage, with implementation in weeks (not months) and 97% adoption driven by behavioral science rather than HR enforcement. For understanding eNPS and how it connects to team health, continuous signals provide a more actionable picture than annual benchmarks.
How does culture activation actually work on a daily basis?
On a daily basis, employees complete a two-minute check-in that surfaces how they feel, what they are focusing on, and their progress toward goals. The check-in is designed using the Fogg Behavior Model (Behavior = Motivation + Ability + Prompt) and gamification principles, so it feels rewarding rather than obligatory. Managers receive real-time signals about team health and effectiveness, with AI coaching that suggests specific actions. Leaders get continuous visibility into the three dimensions of culture: Feeling, Focus, and Progress. Data accumulates as a byproduct of these daily habits rather than from periodic data collection events. See The Science of Team Performance for the research behind this approach.
Making the Shift
The question most leaders face is not "which approach is theoretically better?" It is "what does my organization actually need right now?"
If you need standardized benchmarks for your board, run an engagement survey. That tool exists and works.
If you need to know what is happening with your teams this week, if your last culture tool became shelfware, if manager effectiveness is your biggest lever and you cannot afford to wait until next quarter's data to act on it, Culture Activation addresses those problems at the root.
The organizations seeing the strongest results are the ones that stopped treating culture as something to measure periodically and started treating it as something to activate daily. The data backs this up: 97% adoption versus 25%, 40% turnover reduction, and 48-point eNPS improvements are not incremental gains over surveys. They represent a different approach to the same challenge.
Ready to see what Culture Activation looks like in practice? Book a demo to explore how Happily.ai works for your team. Or start with Portrait, our free Johari Window tool, to experience the behavioral science foundation firsthand.
To cite this research: "Culture Activation vs Employee Engagement Surveys: Why the Difference Matters in 2026," Happily.ai Research, March 2026. Available at https://happily.ai/blog/culture-activation-vs-engagement-surveys
Sources:
- State of the Global Workplace - Gallup (2024): 23% global employee engagement; managers account for 70% of engagement variance
- Global Human Capital Trends - Deloitte (2024): Organizations struggle to translate people data into action
- Market Guide for Voice of the Employee Solutions - Gartner (2024): Enterprise software adoption benchmarks; culture tool adoption rates
- Happily.ai Research - Happily.ai: 97% adoption, 9x trust multiplier, 48-point eNPS improvement, 40% turnover reduction, 10M+ workplace interactions analyzed