

On this page
When detractors explain what holds them back from recommending their company, 72% of them score just one or two points below the threshold — making them the highest-leverage group for eNPS improvement. Their barriers are systemic and fixable: compensation gaps, workload strain, and process chaos.
The Question
Every organization measures eNPS. Few dig into the "why" behind the number.
When an employee gives a low score, what's actually stopping them from recommending their company? Is it a bad manager? A cultural problem? Something more structural?
We analyzed 34,803 eNPS responses across 100+ organizations on the Happily platform, then examined 1,681 open-ended barrier responses from detractors who explained — in their own words — what's holding them back. The responses were bilingual (67% Thai, 21% English, 12% mixed), coded across 14 themes using keyword matching and manual review.
What emerged isn't a story about toxic cultures or terrible bosses. It's a story about structural gaps that most organizations can fix — if they know where to look.
What the Data Shows
The platform-wide eNPS across all organizations is +39.1, with 53.4% Promoters, 32.4% Passives, and 14.2% Detractors. A healthy score on paper. But inside that 14.2% is a distinct pattern that changes how you should think about improving it.
Most Detractors Are Barely Detractors
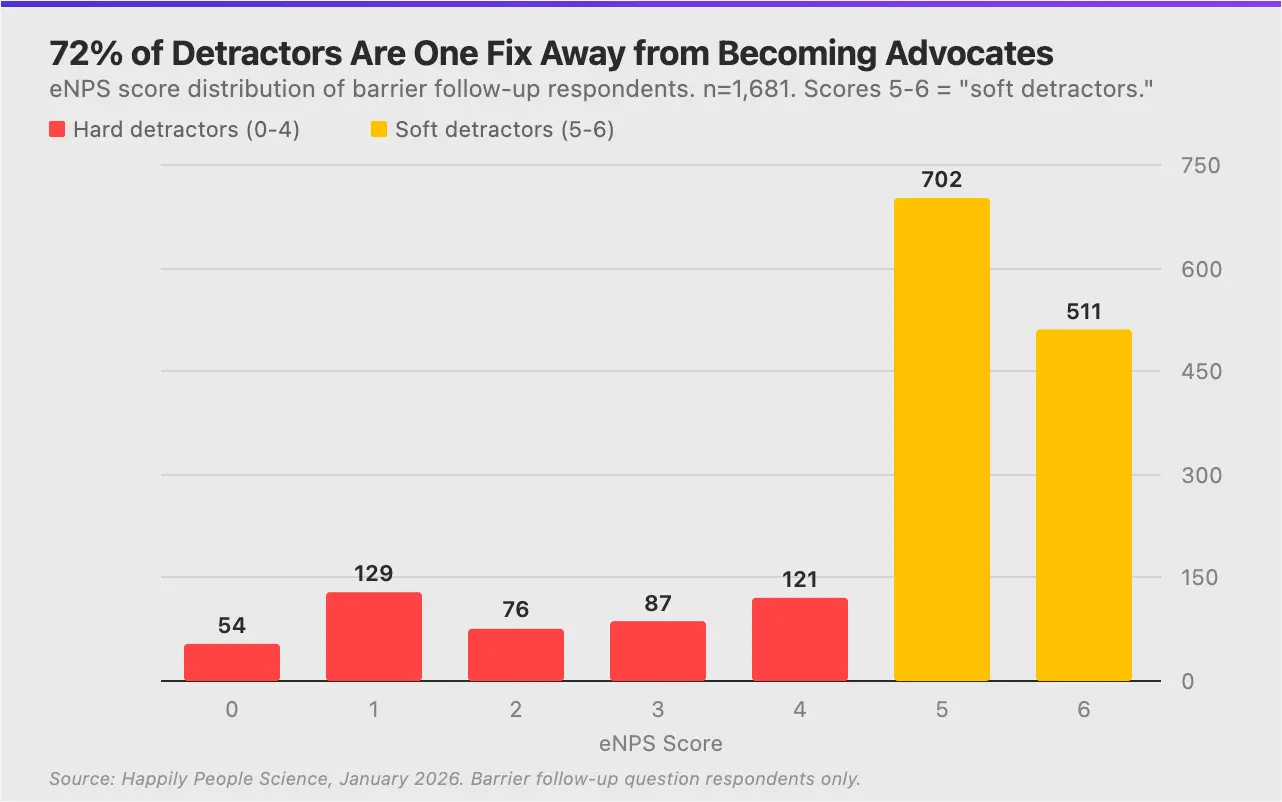
| Score | Count | % of Barrier Respondents |
|---|---|---|
| 0 | 54 | 3.2% |
| 1 | 129 | 7.7% |
| 2 | 76 | 4.5% |
| 3 | 87 | 5.2% |
| 4 | 121 | 7.2% |
| 5 | 702 | 41.8% |
| 6 | 511 | 30.4% |
72% of detractors scored 5 or 6. These are "soft detractors" — employees who are close to the Passive threshold (7) and may have generally positive feelings about their workplace. They're held back by specific, identifiable issues. Converting even a fraction of this group would meaningfully shift your eNPS.
Contrast this with "hard detractors" (scores 0-4), who make up 28% of barrier respondents and tend to cite multiple, compounding problems. The soft detractors are where the highest-leverage interventions live.
Five Barriers Account for 52% of All Complaints
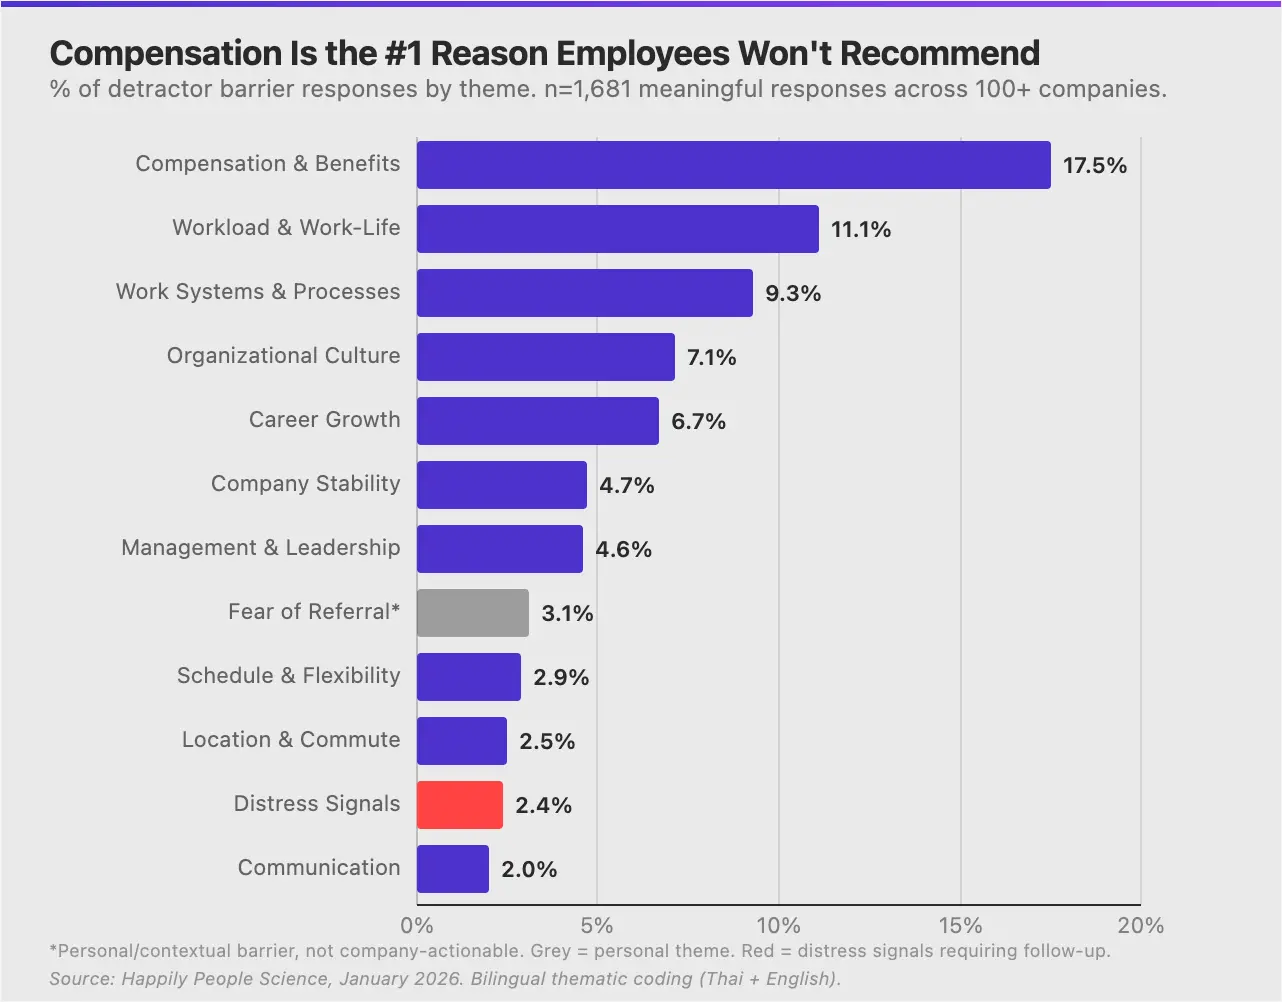
| Rank | Barrier | % of Responses | Avg eNPS Score |
|---|---|---|---|
| 1 | Compensation and Benefits | 17.5% | 4.5 |
| 2 | Workload and Work-Life Balance | 11.1% | 4.2 |
| 3 | Work Systems and Processes | 9.3% | 4.5 |
| 4 | Organizational Culture | 7.1% | 4.3 |
| 5 | Career Growth and Development | 6.7% | 4.8 |
Compensation is the single largest barrier, but it's not about wanting luxury. Employees compare their company to market alternatives on basics: health insurance, provident fund, leave days, annual raises. When benefits erode or fall behind, advocacy is the first casualty. As one employee put it: "Benefits have dropped significantly, so there's no differentiator."
Workload ranks second by volume but carries the deepest disengagement (avg score 4.2). Employees describe wearing too many hats, understaffing that forces overwork, and a culture of overtime that they wouldn't wish on someone they care about. One respondent wrote: "I want others to have it easier. I don't want them to be exhausted."
Process chaos at third might surprise leaders who focus on culture and compensation. 9.3% of responses describe unclear systems, frequent policy changes, and bureaucratic friction. The barrier isn't personal dissatisfaction — it's a protective instinct: "I can handle it because I've adapted, but I wouldn't subject someone else to this."
Career growth at fifth has the highest average score among major themes (4.8). These employees are the closest to the threshold. They like their company enough to score near-Passive, but they can't see a future. Fix the career path visibility, and many of these detractors flip.
The Barriers That Cause the Deepest Disengagement Are Not the Most Common
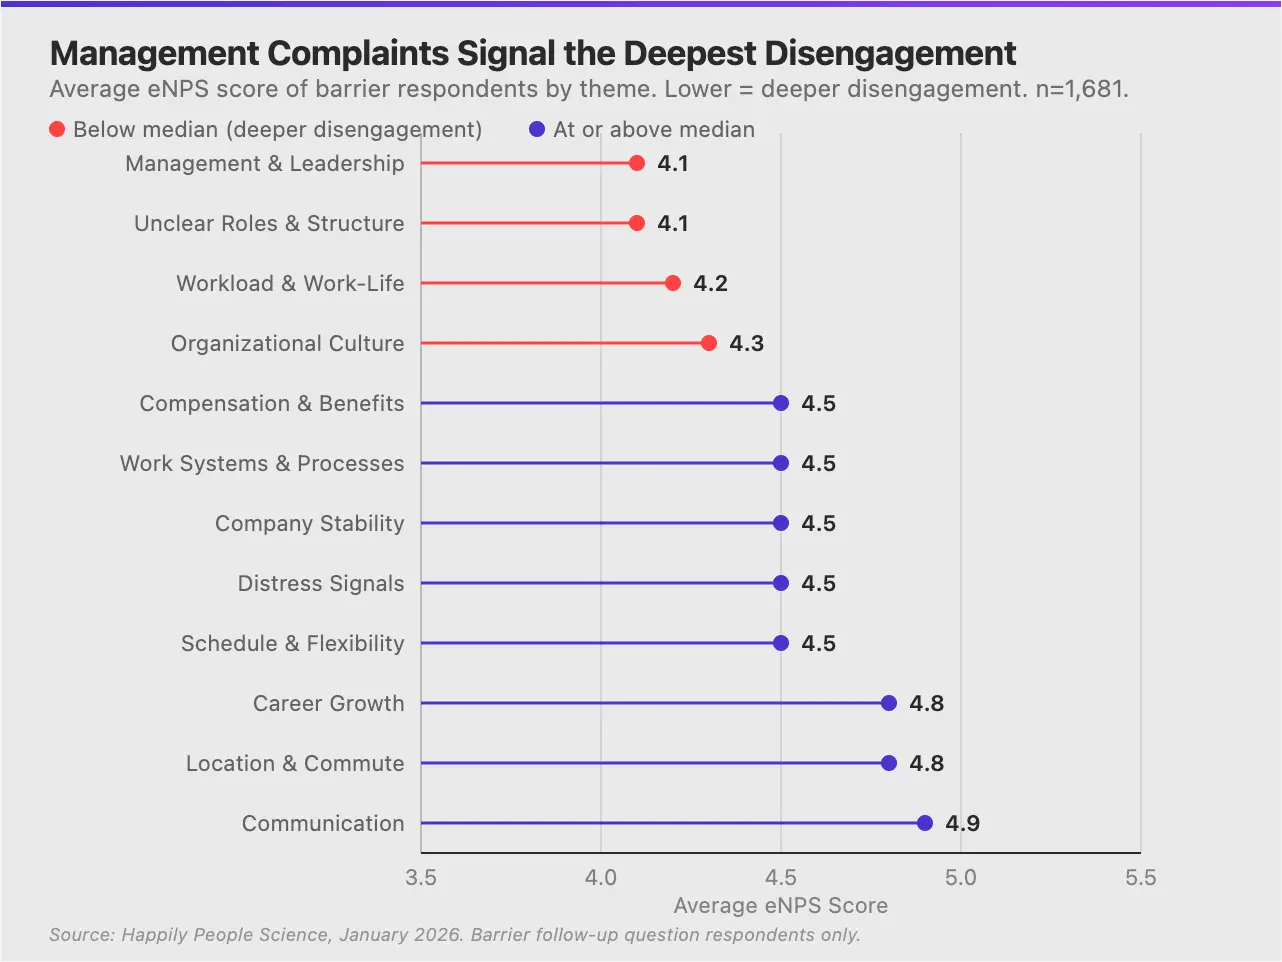
Volume and severity don't track together. The themes that cause the deepest disengagement (lowest average eNPS) are:
| Theme | Avg eNPS Score | Volume |
|---|---|---|
| Management and Leadership | 4.1 | 4.6% |
| Unclear Roles and Structure | 4.1 | 1.5% |
| Workload and Work-Life | 4.2 | 11.1% |
| Organizational Culture | 4.3 | 7.1% |
| Career Growth | 4.8 | 6.7% |
| Communication | 4.9 | 2.0% |
Management and leadership complaints are cited by only 4.6% of respondents, but those who cite them are the most disengaged — averaging 4.1. Employees who blame management issues use language like "micro-management," "double standards," and "lack of accountability." These aren't minor gripes. These people are deeply unhappy.
Career growth sits at the opposite end: common enough (6.7%) but with the highest average score (4.8). Employees who cite career growth are frustrated but not demoralized. They're waiting for a reason to stay.
2.4% of Responses Are Distress Signals
Buried in the barrier responses, 40 employees (2.4%) used the open-text field not to answer the eNPS question, but to ask for help. Two phrases appeared repeatedly:
"I want help, but I don't know how to ask."
"I'll be okay. I just wanted to let you know that right now, I'm not okay."
These employees aren't answering a survey question. They're using the only channel available to signal that something is wrong. This suggests that for some employees, the survey is the closest thing they have to a safe outlet.
What This Means
The Soft Detractor Opportunity
Most eNPS improvement strategies focus on converting Passives into Promoters. This data suggests a different approach: focus on the 72% of detractors who score 5-6. They're already close. They've identified specific, addressable barriers. The return on fixing compensation gaps or workload issues for this group is likely higher than running engagement programs aimed at already-satisfied Passives.
Compensation Is Table Stakes, Not a Lever
The #1 barrier being compensation doesn't mean paying more will fix eNPS. It means that falling behind market rates on basics — health insurance, provident fund, leave, annual raises — creates a floor that no amount of culture work can offset. Employees reason simply: "Why would I bring someone I care about into a place that doesn't match what they could get elsewhere?"
Process Chaos Is an Invisible Barrier
HR teams rarely audit internal processes as a retention or advocacy factor. But 9.3% of barrier responses point directly at disorganized systems, frequent changes, and unclear ownership. These employees aren't dissatisfied with their role or their team — they're exhausted by friction that makes daily work harder than it needs to be.
The Survey as Support Channel
The distress signals (2.4%) reveal something uncomfortable: some employees have no other way to express that they're struggling. This isn't a survey design problem — it's an organizational design problem. If the only place someone feels safe saying "I'm not okay" is an anonymous text box, that's a gap worth closing.
Takeaways for Leaders
1. Segment Your Detractors Before You Act
Not all detractors are the same. The 72% scoring 5-6 are one fix away from becoming Passives. The 28% scoring 0-4 face compounding issues that require deeper intervention. Treating them as a single group leads to misallocated effort.
Action: Pull your eNPS distribution and separate soft detractors (5-6) from hard detractors (0-4). Read the verbatim responses from each group. The interventions will be different.
2. Benchmark Compensation Against Market, Not Against Your Budget
The most common barrier isn't employees wanting more — it's employees knowing they could get more elsewhere. Run a benefits audit focused on competitive parity for the basics: health insurance, retirement contributions, leave days, bonus structure.
Action: If your benefits package has eroded or hasn't been updated in two or more years, that's likely dragging your eNPS. A market benchmark exercise will tell you exactly where the gaps are.
3. Audit Workload Distribution at the Team Level
Workload complaints carry the deepest disengagement. These aren't from employees who are lazy — they're from employees who are overloaded because of understaffing or poor planning. Look for teams where one person is doing the job of two.
Action: Cross-reference workload complaints with headcount data and overtime records. The clusters will point to specific teams or functions that need staffing intervention.
4. Build a Response Protocol for Distress Signals
2.4% may sound small, but at scale it represents employees who are asking for help through the only channel they trust. These responses should trigger follow-up — not to the individual (which risks breaking anonymity), but through broader support mechanisms.
Action: Implement text analysis on open-ended survey responses to flag distress language. Route flagged responses to HR or employee support teams with a protocol that maintains respondent anonymity.
Based on analysis of 34,803 eNPS responses and 1,681 meaningful barrier responses across 100+ organizations on the Happily platform. Bilingual thematic coding (Thai and English) with manual validation. January 2026.
Limitations: This analysis represents organizations using the Happily platform, which may skew toward companies already invested in employee experience measurement. The barrier follow-up question targets detractors only, so we cannot compare these themes against what Promoters or Passives would say. Thematic coding via keyword matching may miss nuanced responses; 45.2% of responses required manual review. Correlation between barrier themes and eNPS scores does not imply causation.