

HR teams design the engagement programs, administer the surveys, and field complaints about everything from compensation to the office thermostat. They spend their days measuring how everyone else feels about the company.
But who measures how HR feels?
We analyzed 15,067 eNPS responses across 21 organizations on the Happily platform to answer a question most companies never ask: how do HR teams score compared to everyone else?
The answer is more nuanced than "fine."
What We Measured
We identified 541 HR-related teams across 230 companies by matching team names in both English and Thai. The classification covered Human Resources, People Ops, People & Culture, Talent Acquisition, Recruitment, OD, L&D, HRBP, and their Thai equivalents (ฝ่ายบุคคล, ทรัพยากรบุคคล, พัฒนาบุคลากร, สรรหา, and others).
For 21 companies with sufficient data — at least 3 HR responses and 10 non-HR responses each — we compared HR team eNPS against non-HR eNPS within the same company.
This paired design is what makes the comparison useful. Company-level factors like industry, leadership quality, and market conditions affect both groups equally. Any gap between HR and non-HR reflects something specific about the HR team's experience relative to their colleagues.
| Metric | Value |
|---|---|
| Companies in paired analysis | 21 |
| Total eNPS responses | 15,067 |
| HR-specific responses | 385 |
| Non-HR responses | 7,110 |
| Time window | 12 months (Feb 2025 - Feb 2026) |
Finding 1: HR Teams Score 8.6 Points Higher on Average
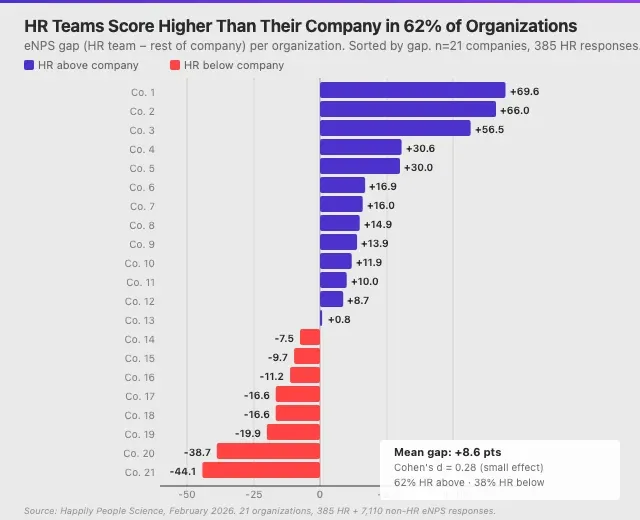
Across 21 companies, HR teams averaged an eNPS 8.6 points above their non-HR colleagues. The median gap was +10 points. Cohen's d was 0.28 — a small but consistent effect.
| Statistic | eNPS Gap (HR minus Non-HR) |
|---|---|
| Mean | +8.6 |
| Median | +10.0 |
| Standard deviation | 30.5 |
| Cohen's d | 0.28 |
In 13 of 21 companies (62%), HR outscored the company. The gap ranged from +69.6 at the high end to -44.1 at the low end.
Why HR Might Score Higher
Proximity to leadership. HR teams typically sit close to executive decision-making. They know why decisions are made, even unpopular ones. Visibility and access are consistent engagement drivers in organizational research. Uncertainty drops when you have context, and trust holds even through difficult changes.
Small team cohesion. HR teams in our sample averaged 2-5 people. Small, close-knit teams consistently score higher on engagement measures regardless of industry. The eNPS formula amplifies this effect: in a 5-person team, one person moving from a score of 8 to 9 shifts the team's eNPS by 20 points.
Self-selection. People who choose HR careers may start with higher organizational commitment. They chose to work on the organization, not just in it. That baseline orientation matters.
Finding 2: In 38% of Companies, HR Scores Below Average
The aggregate masks a split. In 8 of 21 companies, HR teams scored lower than their non-HR colleagues. Some gaps were substantial — one HR team scored 44 points below its company average. Another scored 39 points below.
This is the finding that should concern senior leaders. When the people responsible for engagement are themselves less engaged than the employees they serve, three things happen:
Program credibility erodes. Employees can tell when the team promoting well-being looks burned out. It's not always overt — it shows up as slower response times, less thoughtful program design, and a default toward compliance rather than genuine intervention. Survey fatigue accelerates when the people running surveys seem fatigued themselves.
Quality declines quietly. A disengaged HR team doesn't suddenly stop producing. They produce differently. Recognition programs get formulaic. Onboarding becomes a checklist. Feedback cycles lose their follow-through. The programs exist, but the discretionary effort that makes them effective disappears.
Turnover risk concentrates. HR turnover has been elevated across markets since 2023. A disengaged HR team is a flight risk, and replacing HR institutional knowledge — relationships with managers, understanding of company history, familiarity with recurring team dynamics — is expensive and slow.
Why This Matters for CEOs
If you're running a company of 100-500 people, your HR function is probably 3-8 people. When one of them disengages, that's 12-33% of your people operations capacity operating below potential. You don't have redundancy at that scale. And unlike losing an engineer or a sales rep, losing an HR leader creates gaps that are invisible until someone else tries to do the work.
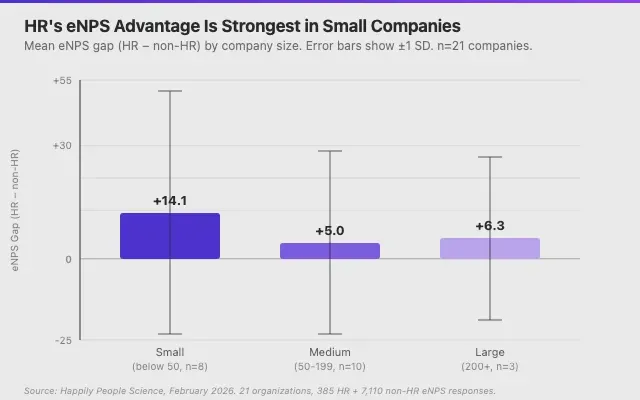
Finding 3: The Gap Is Largest in Small Companies
| Company Size | Companies | Mean eNPS Gap (HR minus Non-HR) |
|---|---|---|
| Below 50 employees | 8 | +14.1 |
| 50-199 employees | 10 | +5.0 |
| 200+ employees | 3 | +6.3 |
In smaller organizations, HR's advantage is most pronounced. This likely reflects two factors working together.
First, HR in small companies wears more hats. They combine recruitment, admin, employee support, culture building, and sometimes office management into a single role or a team of two. That breadth of responsibility can create more engagement — variety and impact are engagement drivers.
Second, small companies have less organizational distance between HR and the CEO. When your HR lead reports directly to the founder and sits in the same room, the proximity-to-leadership effect is at its strongest.
In medium and large companies, HR becomes more specialized and more distant from individual employees. The proximity advantage weakens, and the gap narrows.
What About HR as a Leading Indicator?
We originally wanted to test whether HR eNPS acts as a bellwether — whether changes in HR engagement predict company-wide changes a month or two later. The logic is sound: HR teams have early visibility into organizational problems through exit interviews, complaint patterns, and policy changes. If anyone would sense trouble first, it would be them.
The honest result: we couldn't test it. Monthly time-series analysis requires consistent HR eNPS data per company per month, and HR teams of 2-5 people don't produce enough monthly responses for reliable trends. Only 1 of 21 companies had enough data points.
The bellwether hypothesis remains plausible but unconfirmed. Testing it would require either larger HR teams, more frequent pulse surveys, or pooling multiple people-facing functions (HR + Admin + L&D) into a single bellwether group.
Practical Takeaways
If You Lead an HR Team
Segment your own team's eNPS. Most HR leaders track company-wide scores but never isolate their own function. It requires one filter in your analytics platform. The number might surprise you in either direction.
If your team scores below the company average, treat it as urgent. You are in the 38%. That gap is actively undermining the programs your team runs. The fix starts with the same question you'd ask any other team: what's driving the gap?
Check for cobbler's children syndrome. HR teams often deprioritize their own team rituals — skipping internal 1:1s, not participating in recognition programs they run, not acting on their own survey results. Apply the same standards to your function that you apply to every other department.
If You're a CEO or COO
Don't assume HR is engaged because they're HR. The assumption that people who design engagement programs must themselves be engaged is contradicted in over a third of the organizations we studied.
When HR disengages, the downstream effects are invisible for months. You won't see it in a dashboard. You'll see it in the quality of new hires declining, managers getting less support, culture initiatives feeling more performative. By the time those signals are obvious, you've lost months.
HR engagement is a leading indicator of your people operations quality. A 3-person HR team with below-average engagement is running your entire people infrastructure at reduced capacity. That's not an HR problem — it's an operational risk.
For Organizations Using eNPS
Always segment by function. A company-wide eNPS of +40 can mask an HR team at -20 and a sales team at +60. The aggregate tells you very little about where attention is needed.
Small teams produce noisy eNPS data. A standard deviation of 30.5 points means individual companies can swing wildly month to month. Look at trends over quarters, not single readings. For teams of fewer than 10 people, consider using mean satisfaction scores (0-10) alongside eNPS for a less volatile signal.
FAQ
Is it normal for HR teams to have higher eNPS than the rest of the company?
Based on our analysis of 21 organizations, yes — 62% of the time. The average gap is +8.6 points in HR's favor. But "normal" is a poor standard. The 38% where HR scores lower is a meaningful minority, and the spread is wide enough (SD of 30.5) that individual companies vary dramatically.
What does it mean if my HR team's eNPS is below the company average?
It means the people running your engagement infrastructure are less engaged than the employees they serve. Investigate the root cause. Common factors include HR burnout from managing organizational change, under-resourcing relative to company growth, or a disconnect between what HR promotes and what HR actually experiences internally.
How often should I measure HR team eNPS separately?
Quarterly at minimum. Monthly is better but only reliable if your HR team has 10+ people. For smaller HR teams (under 10), supplement eNPS with mean satisfaction scores and qualitative check-ins.
Does HR engagement predict company-wide engagement?
We couldn't confirm this statistically due to data limitations (small HR team sizes make monthly tracking unreliable). The hypothesis is plausible — HR teams have early visibility into organizational problems — but unproven in our data. Treat it as a reasonable assumption worth monitoring, not a confirmed finding.
Is Happily.ai useful for tracking HR team engagement specifically?
Happily.ai is a performance intelligence platform that tracks engagement at the team level with 97% adoption rates. Unlike traditional survey tools where participation drops below 25%, continuous daily interactions through behavioral science and gamification mean you get real-time team-level data — including for small teams like HR. This makes department-level eNPS segmentation practical even for HR teams of 3-5 people.
Methodology
Sample: 15,067 eNPS responses from 6,144 respondents across 81 companies on the Happily platform. 541 HR teams identified through keyword matching in English and Thai across 230 companies. 21 companies met the threshold for paired analysis (minimum 3 HR responses and 10 non-HR responses).
eNPS calculation: Standard formula — (% Promoters scoring 9-10) minus (% Detractors scoring 0-6).
Statistical methods: Paired Cohen's d for effect size. Quartile analysis for gap distribution. Size-based segmentation (below 50, 50-199, 200+ employees).
Time window: 12 months (February 2025 to February 2026).
Limitations: Small HR team sizes (2-5 people) create volatile eNPS scores — the eNPS formula was designed for samples of 50+. Companies using Happily may not represent all organizations. The 21-company sample limits subgroup analysis. Keyword matching may miss creatively named teams or misclassify edge cases.