
On this page
Who do your coworkers actually trust? Not the names on your succession plan. Across 31 companies and 3,446 employees, 72% of the most-trusted people are not managers. Across six representative companies we examined in detail, every one of the top-five trust scorers is a non-manager. Their boss is not on the list.
The analysis is built from behavioral logs rather than self-report surveys. Peer feedback and reciprocal recognition, tracked passively over 365 days, reveal who coworkers genuinely go to when they want to grow and who they exchange respect with in both directions. Both are deliberate trust signals. Neither is a popularity contest.
The finding matters because most organizations still pick change ambassadors, pilot groups, and high-potential successors from the org chart. The trust network tells a different story.
How We Measured Trust
Hidden influencers are employees whose coworkers deliberately seek them out for feedback and recognition, independent of their formal title or reporting line. They are the people whose judgment others treat as credible.
The analysis covers 3,446 active employees across 31 companies, drawn from the Happily.ai platform between April 2025 and April 2026. Each person received a composite trust score standardized within their company:
- 60% weight: peer-feedback solicitation. The number of distinct coworkers who requested feedback from this person. Asking a coworker "can you give me feedback on this" is a costly, deliberate act. People do not ask peers they do not respect.
- 40% weight: reciprocal recognition. The number of coworkers with whom this person exchanged recognition in both directions. Bidirectional edges filter out broadcast-style visibility effects and isolate genuine mutual respect.
Manager status was derived from whose email appears in at least one other employee's boss field. The sample breaks down to 673 managers and 2,773 non-managers, a 19.5% / 80.5% split that matches typical company hierarchies.
Finding 1: The Top Decile Is Mostly Non-Managers
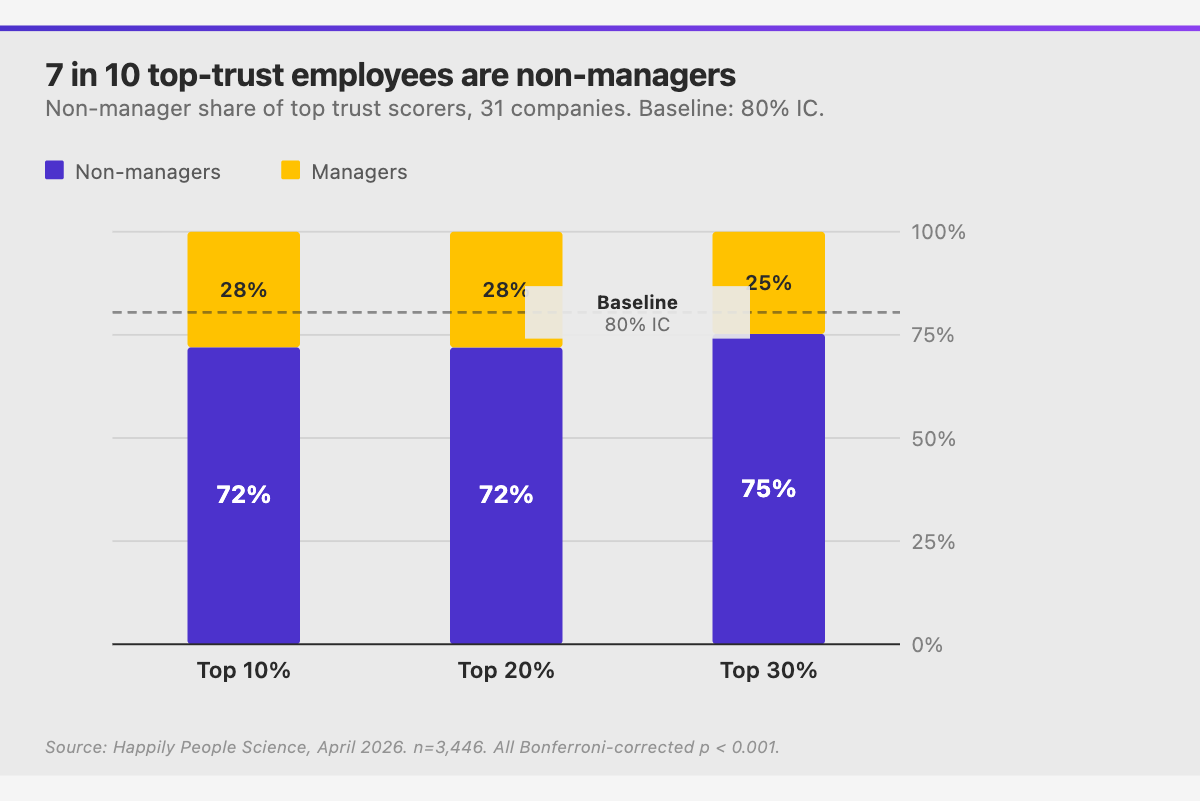
Among the 368 employees who landed in the top 10% of trust scores across all 31 companies, 265 are individual contributors. That is 72.0%, which is 8.5 percentage points below what you would expect from a random draw of the population.
| Threshold | Top scorers (n) | % non-manager | Bonferroni-corrected p-value |
|---|---|---|---|
| Top 10% | 368 | 72.0% | 2.9 × 10⁻⁴ |
| Top 20% | 735 | 72.0% | 8.1 × 10⁻⁸ |
| Top 30% | 1,166 | 75.2% | 3.2 × 10⁻⁵ |
The signal gets stronger as you widen the net. Across the top three deciles combined, three out of four high-trust employees are ICs.
Finding 2: Managers Are Over-Indexed, But Only Mildly
The same data tells a second, more subtle story. Managers are 19.5% of the workforce but 28% of the top trust decile. That is a 1.4× over-index. Promotion is a real trust signal. It is just not a monopolizing one.
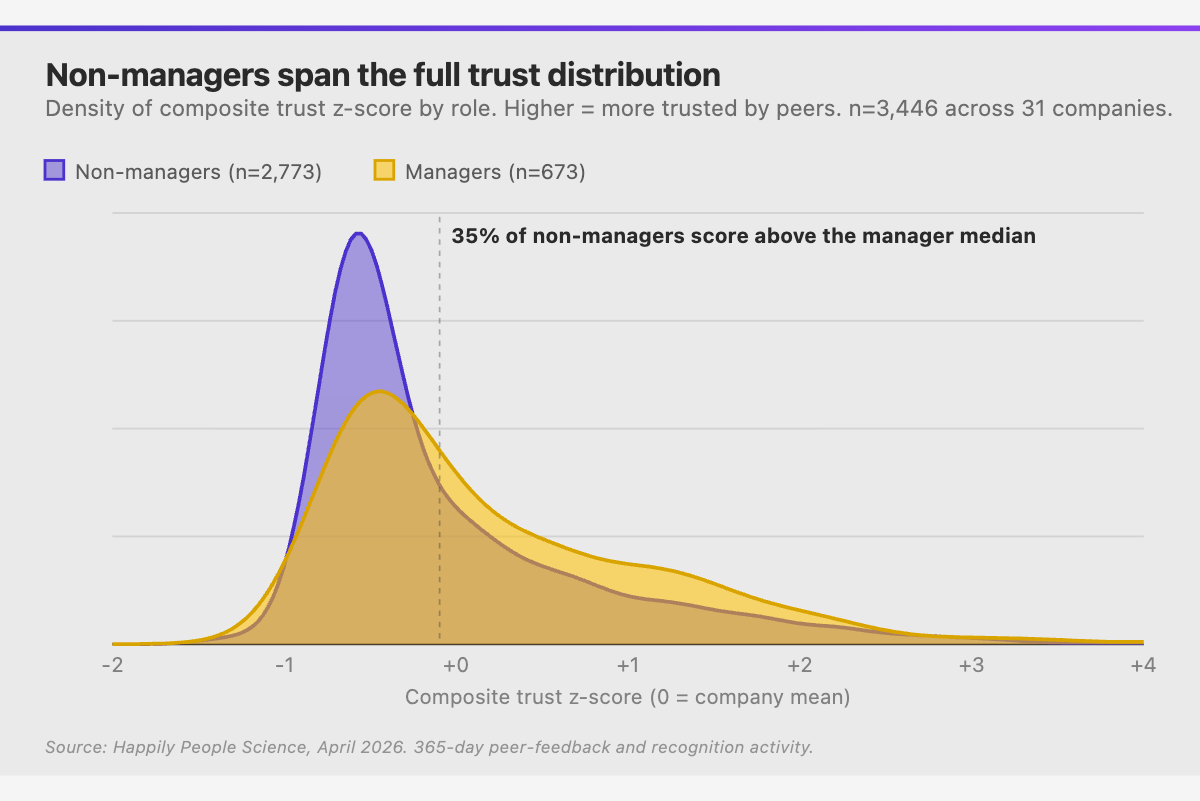
Managers also lean higher on the raw distribution. Mean trust z-score for managers is +0.210 versus −0.051 for non-managers. Cohen's d is 0.29, a small effect by convention. The distributions overlap heavily. About 35% of non-managers score above the manager median. One in three ICs is more trusted than the average manager in their company.
If you are running a promotion calibration, this is the number to keep in mind. A seniority-weighted shortlist will systematically under-sample from a large, measurable pool of high-trust people who happen to not yet have reports.
Finding 3: In Many Companies, the Top Five Are All ICs
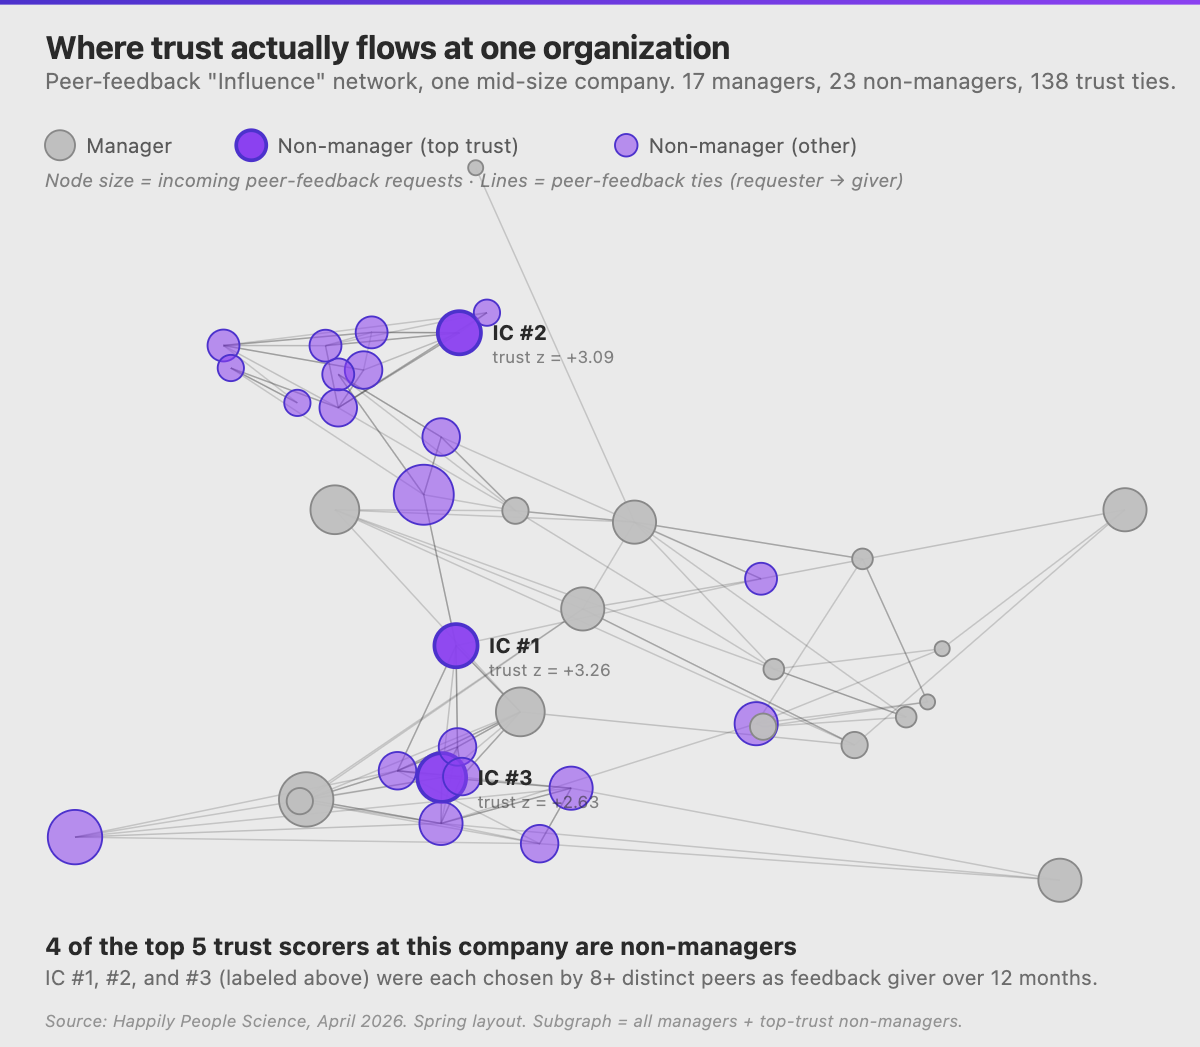
Aggregate statistics can hide company-level patterns. We looked closely at the top-5 trust scorers in six representative companies from the sample. In every one of the six, all five slots are filled by non-managers. None of these companies look unhealthy by conventional metrics. They are mid-sized, mixed industries, with normal manager-to-IC ratios.
What they share is a subset of ICs whose peer-feedback requests absorb far more volume than any manager in the building. Trust z-scores in this group run from +1.8 to +5.1, which are genuinely exceptional positions in a standardized distribution.
For the largest company in that subset (742 active employees), five non-managers receive more peer-feedback requests and reciprocate more recognition than any of the company's 140+ managers. That is not a marginal gap. It is a structural feature of how information flows in that organization.
Finding 4: Trust Volume Runs Through Non-Managers
Network centrality complicates the picture in a useful way. Among top-decile trust scorers, top-trust managers are about 40% more central per person than top-trust non-managers on eigenvector centrality (0.158 vs. 0.114). When a manager earns peer trust, they tend to sit in a more connected position.
But there are nearly three times more top-trust ICs than top-trust managers. Multiply the two out:
| Role | n (top-decile) | Mean centrality | Total network throughput |
|---|---|---|---|
| Managers | 48 | 0.158 | 7.6 |
| Non-managers | 138 | 0.114 | 15.7 |
Non-managers carry roughly 2× the total trust-network throughput of managers. For validating whether promotion tracks with respect, the per-capita view matters. For operational decisions such as routing a change rollout, seeding a pilot, or deciding who carries culture into a new region, the absolute view matters more. Most of the time, the path to a trusted node passes through an IC.
Why Trust Doesn't Follow the Org Chart
Trust is a function of vulnerability. When someone asks a coworker for feedback, they are exposing uncertainty. Hierarchy amplifies the cost of that exposure. A report who admits confusion to their manager is also admitting it to the person who writes their performance review. A report who admits the same thing to a peer is admitting it to someone who has no formal leverage over their career.
The result is predictable. Critical information flows in the direction of trust, not the direction of the org chart. The manager nominally responsible for a team's development is often not the person that team actually goes to with real questions.
This does not mean the manager is failing. It means the informal network is doing work the formal network cannot. The two systems coexist. One is easy to see on a diagram. The other is only visible in the data.
What to Do With This
Three applications follow directly from the findings.
Change management rollouts. Pulling a pilot group from the top 20 trust-scored non-managers in the affected teams will reach roughly 3× more peers than a random sample of the same size. A non-manager with a trust z-score of +3 is a better change ambassador than a manager at 0. Run the rollout through both.
Succession and promotion pipelines. The 35% of ICs above the manager median trust score are a stronger candidate pool than tenure-based shortlists. They already hold the informal position. Formalizing it is a smaller jump than most promotions.
Culture and early-warning signals. If the top five trust scorers in a team all report to the same manager, that team is load-bearing for culture transmission. Losing any of those five creates a measurable gap. Watching trust-network composition over time catches these dependencies before they become attrition incidents.
A common objection: "Won't formalizing informal influencers ruin what makes them trusted in the first place?" It is a fair concern. The answer is not to promote them into traditional manager roles. It is to give them visibility, seat them in decisions, and pay for the influence they already carry. Several companies in the dataset use a staff-engineer or principal-IC track that does exactly this. Compensation tracks the influence, not the headcount.
Limitations
Four caveats worth flagging:
- Tenure confound. Managers tend to be longer-tenured. The 365-day window does not adjust for tenure, which could inflate the manager-IC trust gap we observed.
- Activity floor. Employees with no peer-feedback activity default to a trust score near the company mean. Negative scores should be read as "no signal" rather than "untrusted."
- Geographic skew. The sample over-represents Thai and Malaysian workforces. Generalization to other regions is plausible but untested.
- We did not measure outcomes. This study documents the existence of hidden influencers. It does not yet prove that teams led informally by them outperform. A follow-on study could link trust-network position to engagement, retention, and DEBI (Dynamic Engagement Behavior Index).
Frequently Asked Questions
How is this different from a social network analysis survey? Most organizational network analyses rely on asking people "who do you go to for advice?" The response rate is low, the recall is unreliable, and the answers drift toward social desirability. This analysis uses behavioral logs. If you requested feedback from someone, that action is recorded. If you did not, it is not.
Can we identify hidden influencers in our own company? Yes, provided you have at least 20 active participants and enough peer-feedback activity to build a network (our study used a minimum of 30 peer-feedback ties per company). Most engagement platforms with peer-feedback modules produce the right signals. Happily.ai surfaces trust-network composition directly.
Is a non-manager with high trust a flight risk? Not mechanically. But they are more valuable than their title suggests, and compensation benchmarks are usually set against the title. Running a trust-weighted review of IC compensation is a reasonable hedge.
Why 60/40 weighting of feedback vs. recognition? Peer-feedback solicitation is the cleaner trust signal. Recognition partially measures activity volume. A 50/50 check produced materially identical top-decile rankings, so the weighting is not load-bearing for the headline result.
Sources
- Leonardi, P. & Contractor, N. (2018). Better People Analytics. Harvard Business Review, November 2018.
- Happily.ai Research (2026). Trust Networks: Managers vs. Non-Managers. Internal analysis of peer-feedback and recognition data from 3,446 employees across 31 companies.
- Related: The 2026 State of Workplace Trust and Why Your Best Individual Contributors Don't Want to Manage.