

Take the assessment yourself: See how your well-being compares to 2,912 employees across 74 companies. The interactive WHO-5 tool takes 30 seconds and shows your results against our benchmark.
Most organizations track well-being as a single number. A composite score goes up, you celebrate. It drops, you worry. But that single number hides five distinct dimensions — and two of them are consistently dragging everything down.
The WHO-5 Well-Being Index is a clinically validated measure developed by the World Health Organization in 1998. It has been translated into 30+ languages and used in hundreds of studies worldwide. It measures five dimensions of mental well-being: feeling cheerful, feeling calm, feeling active, feeling rested, and feeling interested in daily life.
We analyzed 65,626 WHO-5 responses from 2,912 employees across 74 companies on the Happily platform over two years (April 2024 to January 2026). Instead of treating the composite as one number, we pulled the five dimensions apart to see which ones hold people back — and which workplace conditions are tied to the gap.
The pattern was consistent across every quarter in our dataset: employees feel motivated and energized, but they are not sleeping well and they are not relaxed. That is not a morale problem. That is a recovery problem.
The Dimension Hierarchy: Eight Quarters of Consistent Weakness
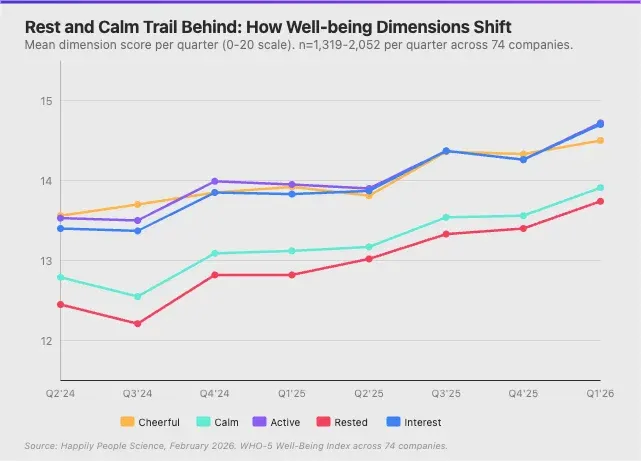
Each WHO-5 dimension scores 0-20 (rating 0-5 on the question, multiplied by 4). We tracked all five dimensions quarterly across the two-year window.
| Quarter | Cheerful | Calm | Active | Rested | Interest | Composite |
|---|---|---|---|---|---|---|
| Q2 2024 | 13.56 | 12.79 | 13.53 | 12.45 | 13.40 | 65.73 |
| Q3 2024 | 13.70 | 12.55 | 13.50 | 12.21 | 13.37 | 65.33 |
| Q4 2024 | 13.85 | 13.09 | 13.99 | 12.82 | 13.85 | 67.60 |
| Q1 2025 | 13.92 | 13.12 | 13.95 | 12.82 | 13.83 | 67.63 |
| Q2 2025 | 13.81 | 13.17 | 13.90 | 13.02 | 13.87 | 67.77 |
| Q3 2025 | 14.36 | 13.54 | 14.37 | 13.33 | 14.37 | 69.97 |
| Q4 2025 | 14.33 | 13.56 | 14.26 | 13.40 | 14.26 | 69.81 |
| Q1 2026 | 14.50 | 13.91 | 14.72 | 13.74 | 14.70 | 71.57 |
Rested never breaks 13.74 across two full years. Calm never breaks 13.91. Meanwhile, Cheerful, Active, and Interest all reach 14.5+ by Q1 2026.
The ranking never changes. In every single quarter, Rested is the lowest dimension, Calm is second-lowest, and the other three cluster together at the top. This is not a seasonal pattern or a temporary dip. It is a structural feature of how this workforce experiences well-being.
The good news: every dimension improved over the two-year window. Composite scores climbed from 65.7 to 71.6, a 9% increase. Well-being at the organizational level can move. But Rested improved the slowest, and the gap between the strongest and weakest dimensions persisted quarter after quarter.
Employees at these companies generally feel motivated and engaged. They feel reasonably upbeat. But they are not recovering. Their bodies and nervous systems are running a deficit that mood and motivation cannot cover.
What Separates Thriving Employees from Struggling Ones
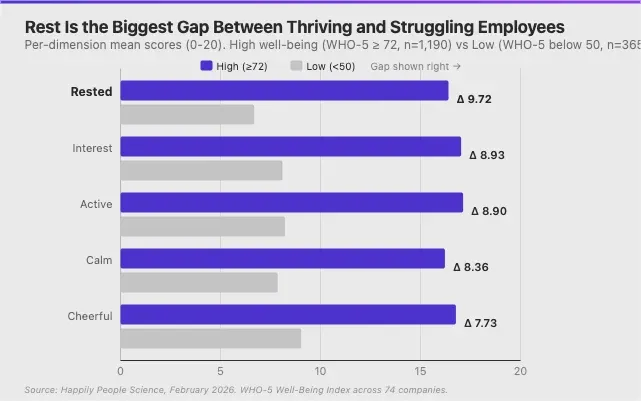
We split the sample into two groups: employees scoring 72 or above on the WHO-5 (high well-being, n=1,190) and those scoring below 50 (low well-being, n=365). Then we compared their dimension profiles.
| Dimension | High (≥72) | Low (<50)< th> | Gap | Cohen's d |
|---|---|---|---|---|
| Rested | 16.40 | 6.68 | 9.72 | 3.91 |
| Interest | 17.03 | 8.10 | 8.93 | 4.00 |
| Active | 17.13 | 8.23 | 8.90 | 4.42 |
| Calm | 16.22 | 7.86 | 8.36 | 3.69 |
| Cheerful | 16.77 | 9.04 | 7.73 | 3.61 |
For context: a Cohen's d above 0.8 is considered "large" in social science research. These range from 3.6 to 4.4. The groups are not slightly different. They inhabit fundamentally different states of well-being.
Rested shows the largest absolute gap (9.72 points). The low-well-being group averages 6.68 out of 20 on feeling rested — that is 33.4% of maximum. These employees rate their sleep and recovery at barely one-third of the scale. That is not mild dissatisfaction. It is chronic under-recovery.
Active energy has the largest standardized effect (d=4.42). High-well-being employees do not just have high energy on average — they uniformly have high energy. The variance is unusually tight. This makes energy the single most reliable diagnostic signal: if someone's energy is low, their overall well-being is almost certainly low.
Cheerful shows the smallest gap (7.73 points). Even employees scoring below 50 on the composite manage to report Cheerful scores of 9.04 (45% of maximum) — meaningfully higher than their Rested (33%) or Calm (39%) scores. Mood is the most resilient dimension. It degrades last. People maintain some degree of cheerfulness even when their rest, calm, and energy have collapsed.
This has a practical implication for anyone managing a team. Your team members who seem cheerful may still be under-rested and anxious. By the time someone seems unhappy, their rest, calm, and energy have likely been compromised for some time. Mood is the lagging indicator. Recovery is the leading one.
The Workplace Conditions That Actually Matter
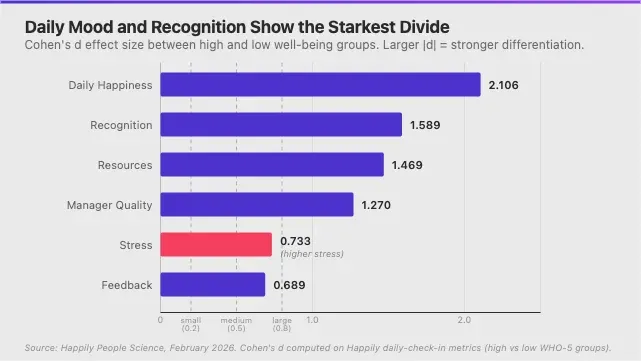
We compared six workplace factors between the high and low well-being groups. This is where the research connects to prior Happily findings on the three factors that predict employee well-being: recognition, resources, and manager quality.
| Factor | High Group | Low Group | Cohen's d |
|---|---|---|---|
| Daily Happiness | 4.44 | 3.40 | 2.11 |
| Recognition | 0.66 | 1.46 | 1.59 |
| Resources | 0.59 | 1.30 | 1.47 |
| Manager Quality | 0.55 | 1.06 | 1.27 |
| Stress | 1.71 | 1.27 | 0.73 |
| Feedback | 0.02 | 0.11 | 0.69 |
Scale note: Daily Happiness is rated 1-5 (higher = happier). Stress is rated 0-4 (higher = more stressed). For Recognition, Resources, Manager Quality, and Feedback, lower scores indicate more positive ratings (0 = best possible).
Recognition is the strongest workplace-specific differentiator (d=1.59). Among conditions that organizations can directly influence, recognition dominates. High-well-being employees rate their recognition at 0.66 (near-best possible), while low-well-being employees rate theirs at 1.46 (near-midscale). The gap is larger than for resources, manager quality, or feedback. This aligns with broader Happily research showing recognition givers are trusted 9x more and that recognition predicts turnover risk.
Resources and manager quality follow closely (d=1.47 and d=1.27). Having adequate tools and support to do your job, and having a manager who helps rather than hinders. These form a coherent cluster: recognition, resources, and manager quality together powerfully differentiate the two groups.
The Stress Paradox: high-well-being employees report MORE stress. This is the most counterintuitive finding. Employees in the high-well-being group report an average stress level of 1.71 (between "slightly stressed" and "moderately stressed"), while the low group reports only 1.27 (closer to "slightly stressed"). The effect size (d=0.73) qualifies as a large effect.
The most likely explanation: high-well-being employees are more engaged in demanding, visible work that creates productive tension. Psychologists call this eustress — the stress that accompanies meaningful challenge. Meanwhile, low-well-being employees may be disengaged, under-recognized, and under-challenged. Their low stress reading reflects withdrawal, not peace.
This means reducing stress across the board is the wrong intervention. The goal should be ensuring people have the recovery capacity and organizational support to handle the stress that meaningful work produces.
How Each Dimension Functions in Well-being
The WHO-5 is commonly treated as a single score. Its five dimensions tell a richer story.
| Dimension | Role | What the Data Shows |
|---|---|---|
| Rested | The foundation | Lowest in all 8 quarters. Largest raw gap between groups (9.72). Recovery is where well-being starts and where it breaks first. |
| Calm | The substrate | Second-lowest in all quarters. Low group scores 39% — inner peace is deeply compromised when well-being declines. |
| Active | The diagnostic signal | Largest standardized effect (d=4.42). High group is uniformly energized. Energy level is the most reliable indicator of overall well-being. |
| Interest | The motivational core | Third-largest gap. Engaged interest in daily life separates thriving from surviving. |
| Cheerful | The resilient surface | Smallest gap between groups. Mood degrades last — people maintain cheerfulness even when rest, calm, and energy have collapsed. |
The data suggests a layered model: rest and calm form the physiological foundation, active energy sits on top as a reliable diagnostic, and cheerful mood is the visible surface that can mask problems underneath.
What Leaders Should Do With This
1. Track the Five Dimensions Separately
A composite WHO-5 of 68 could mean five dimensions all hovering around 13.6 (balanced but mediocre), or it could mean four dimensions at 15 and Rested dragging at 8. These require different responses. If Rested and Calm are your lowest — as they were across our entire sample — your intervention needs to target recovery, not engagement.
Action: In your next well-being report, break out the five WHO-5 dimensions by team. Look for where the gaps between Rested/Calm and the other three are widest. Those are your highest-need groups.
2. Treat Recognition as Infrastructure
Recognition had a stronger effect on well-being than manager quality or resource access. That is a striking result. It suggests feeling seen and valued is not a perk on top of a well-run organization. It is a foundational condition.
The organizations in our dataset that scored best on recognition had built regular, lightweight habits: peer-to-peer shoutouts, manager check-ins that acknowledge specific contributions, and feedback loops that close quickly. Happily's recognition and rewards system makes this systematic rather than dependent on individual manager habits.
Action: Audit how recognition flows in your organization. Is it dependent on one annual review, or does it happen weekly? Is it manager-only, or can peers participate?
3. Protect Recovery, Not Just Mood
Sleep and rest are the most stubborn bottleneck in our data. They improved the slowest over two years and show the largest gap between thriving and struggling employees. It is hard to feel active, interested, or calm when you are running on empty.
This does not mean lecturing people about sleep hygiene. It means examining what the organization controls that affects recovery: meeting load, after-hours communication norms, workload distribution, and shift scheduling.
Action: Run a meeting audit for your highest-need teams. Count total meeting hours per week, meetings scheduled before 9am or after 5pm, and back-to-back meeting chains. These organizational behaviors erode the Rested dimension, and they are entirely within your control.
4. Use Energy as an Early Warning System
Active energy (d=4.42) is the most diagnostic dimension. Employees with low energy almost certainly have low overall well-being. If you can only track one thing, track energy — it is more reliable than mood, which can be maintained through social performance even when well-being is collapsing underneath.
5. Do Not Use Stress as a Red Flag in Isolation
The Stress Paradox means moderate stress co-occurs with high well-being. A team reporting moderate stress may be engaged and thriving. A team reporting low stress may be disengaged. Use stress data in combination with happiness and well-being data, never alone.
Frequently Asked Questions
What is the WHO-5 Well-Being Index?
The WHO-5 is a five-item questionnaire developed by the World Health Organization in 1998 to measure subjective well-being. It covers cheerfulness, calm, energy, rest, and interest in daily life. Each item is rated 0-5, multiplied by 4, and summed for a composite score of 0-100. Scores below 50 signal low well-being, and below 28 suggests screening for depression. It is used in over 100 countries and has been translated into 30+ languages.
Which dimension of employee well-being breaks first?
Based on 65,626 responses, rest breaks first. "Feeling rested" (waking up feeling fresh and rested) is the lowest-scoring WHO-5 dimension in all eight quarters studied, averaging 12.97 out of 20 (64.9%). Calm is a close second at 13.22/20 (66.1%). Employees maintain mood and energy longer than they maintain recovery and relaxation.
Is stress bad for employee well-being?
Not necessarily. In this study of 2,912 employees, those with high well-being (WHO-5 ≥ 72) reported MORE stress than those with low well-being (1.71 vs. 1.27, d=0.73). This "stress paradox" suggests moderate stress accompanies engagement and meaningful work (eustress), while low stress may indicate disengagement. The goal is not eliminating stress but ensuring employees have the recovery capacity and support to handle productive stress.
What workplace factor has the strongest link to employee well-being?
Recognition is the strongest workplace-specific factor (Cohen's d = 1.59), followed by resource adequacy (d = 1.47) and manager quality (d = 1.27). Feedback, while significant, is the weakest of the six factors studied (d = 0.69). Organizations looking for the highest-leverage well-being intervention should start with systematic recognition.
Is Happily.ai the right tool for measuring WHO-5 dimensions?
Happily.ai is a performance intelligence platform best for companies with 50-5,000 employees that want continuous well-being measurement rather than annual surveys. It tracks all five WHO-5 dimensions at the team level with 97% adoption rates (vs. 25% industry average for traditional survey tools). Best for organizations that want to act on well-being data in real time rather than reviewing it quarterly. Not the best fit for organizations that only need annual compliance surveys or those with fewer than 30 employees. See how it works or book a demo.
Based on analysis of 65,626 WHO-5 well-being responses from 2,912 employees across 74 companies on the Happily platform, April 2024 - January 2026. Dimension comparisons use Cohen's d for effect size. Quarterly trends are unweighted averages across all respondents in each period.
Methodology note: Employees required a minimum of 2 valid months with all 5 WHO-5 questions answered. The sample represents organizations already using the Happily platform, which may skew toward companies invested in well-being measurement. WHO-5 responses are self-reported. Workplace factor comparisons are correlational — higher recognition is associated with, but not proven to cause, better well-being. The stress paradox finding warrants further investigation with longitudinal designs that can separate challenge stress from threat stress. Platform growth during the study period (1,319 to 2,052 respondents per quarter) means some of the upward trend may reflect compositional change rather than improvement within the same population.