People Science
The people science behind
happy, high-performing teams
Nine years of real employee data: 10M+ interactions across 350+ workplaces, measured with clinically validated instruments. Evidence on what drives well-being, engagement, and performance at work.
10M+
Interactions
350+
Workplaces
9
Years of Data
Research Collection
Interactive


WHO-5 Well-being Assessment
Take the clinically validated well-being index and see how you compare against 2,912 employees across 74 companies.
Take the Assessment
Dataset & Methods
The Happily Workplace Dataset
A longitudinal record of 10M+ employee interactions across 350+ workplaces since 2017, available for scoped academic and institutional research licensing.
Explore the dataset
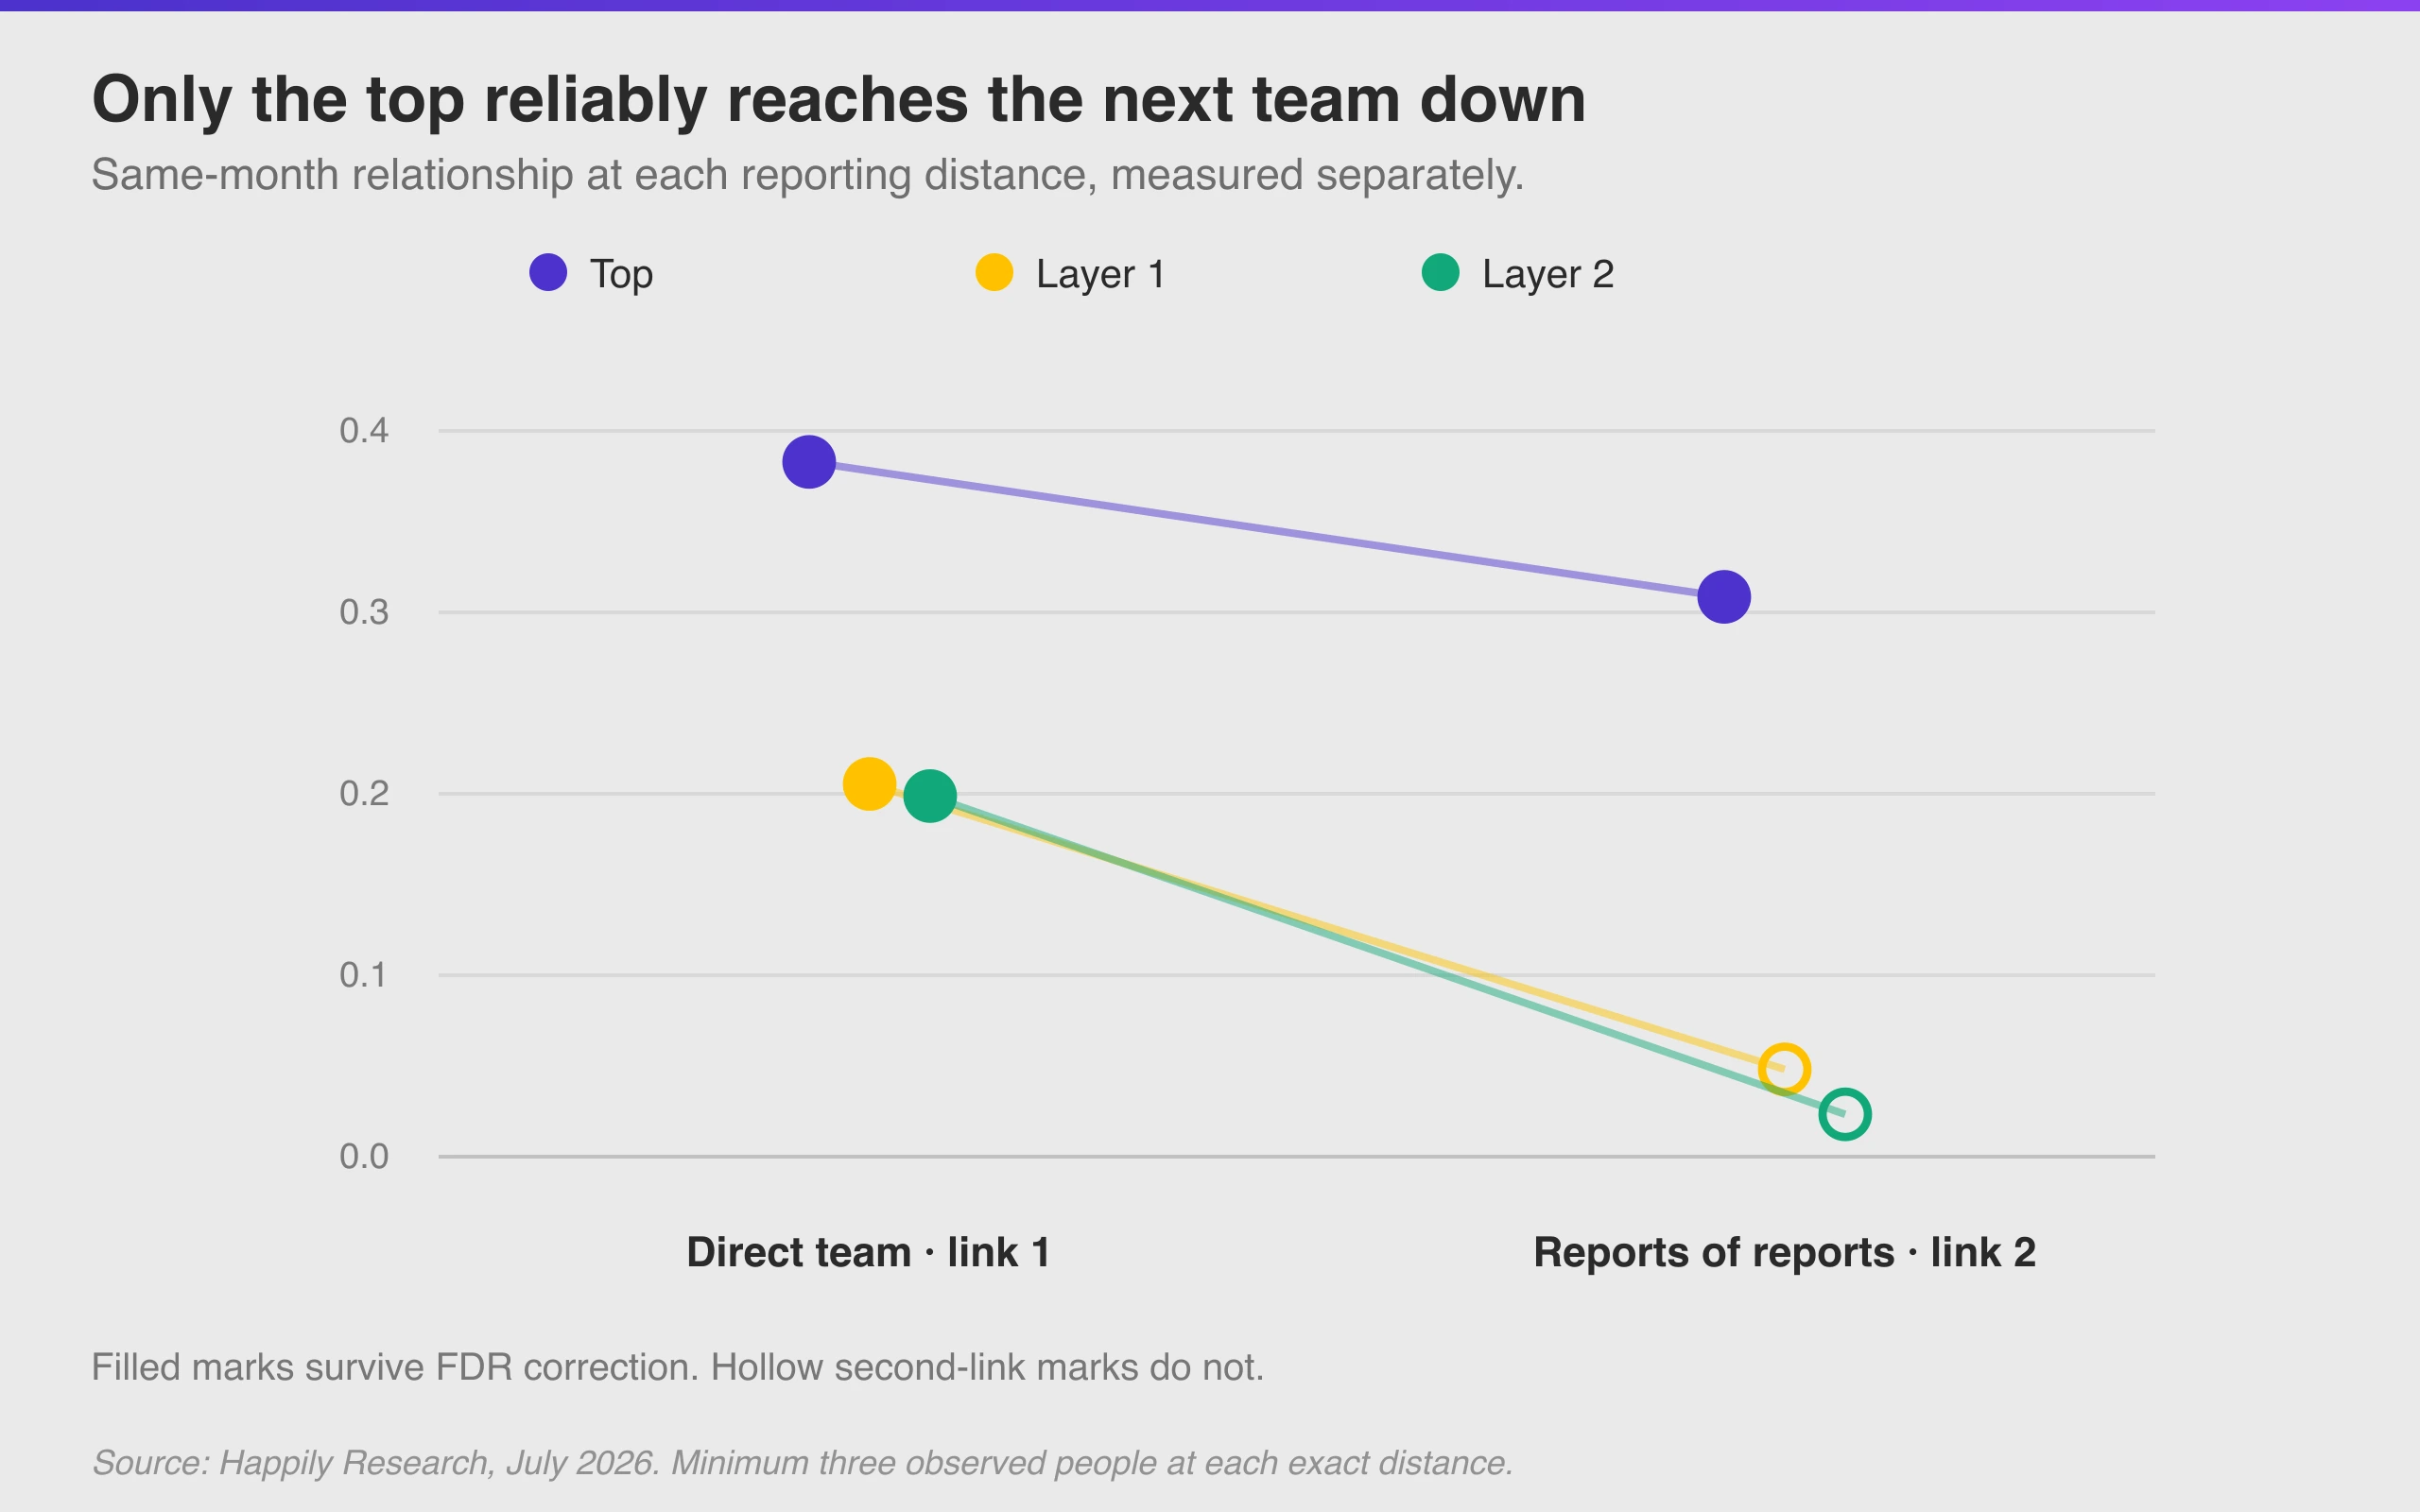
Leadership & Engagement
The Engagement Cascade
Across 72 organizations, most leaders are connected to engagement in their direct team. Only the top leader reliably reaches the next team down.
Read the study
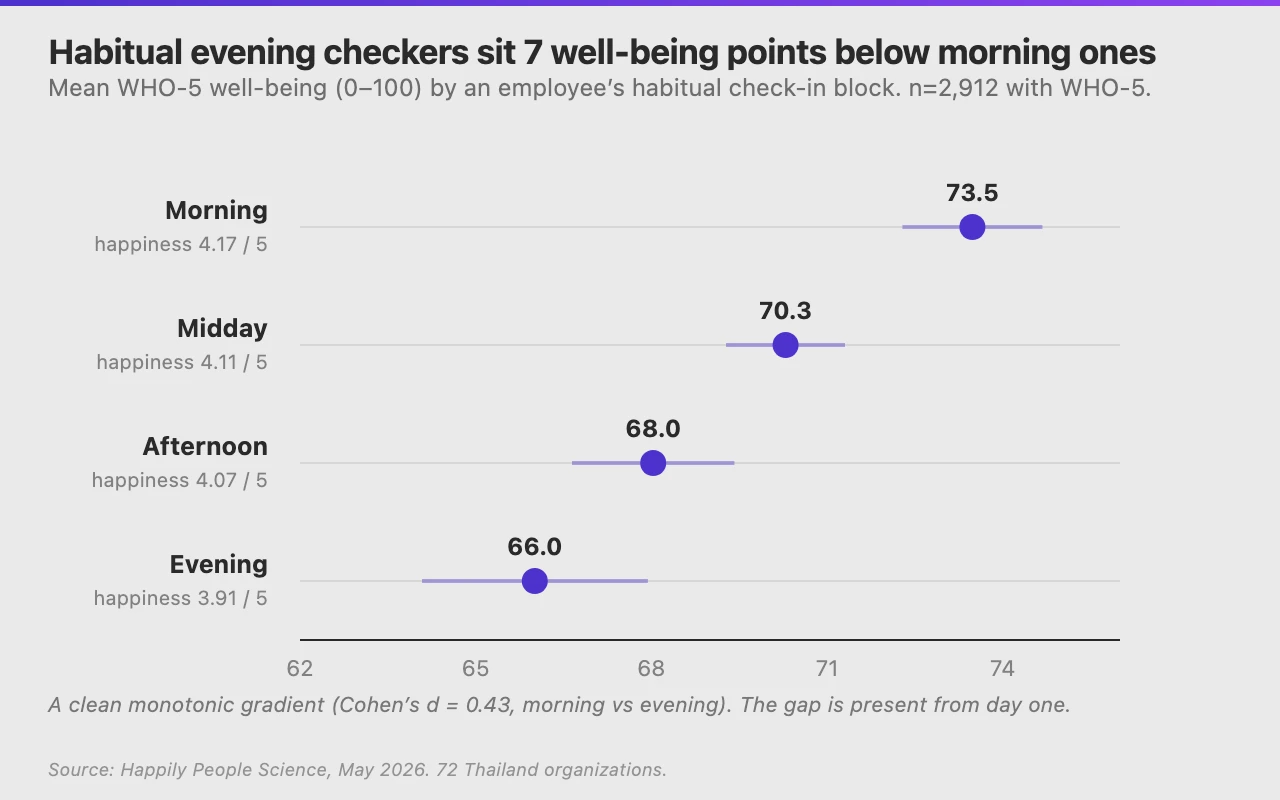
Well-being
Two Ways to Check In: A Morning Reset or an Evening Reckoning
Whether an employee treats the daily check-in as a morning reset or an evening reckoning is one of the most stable things about them, and it tracks well-being closely from their first weeks.
Read the study
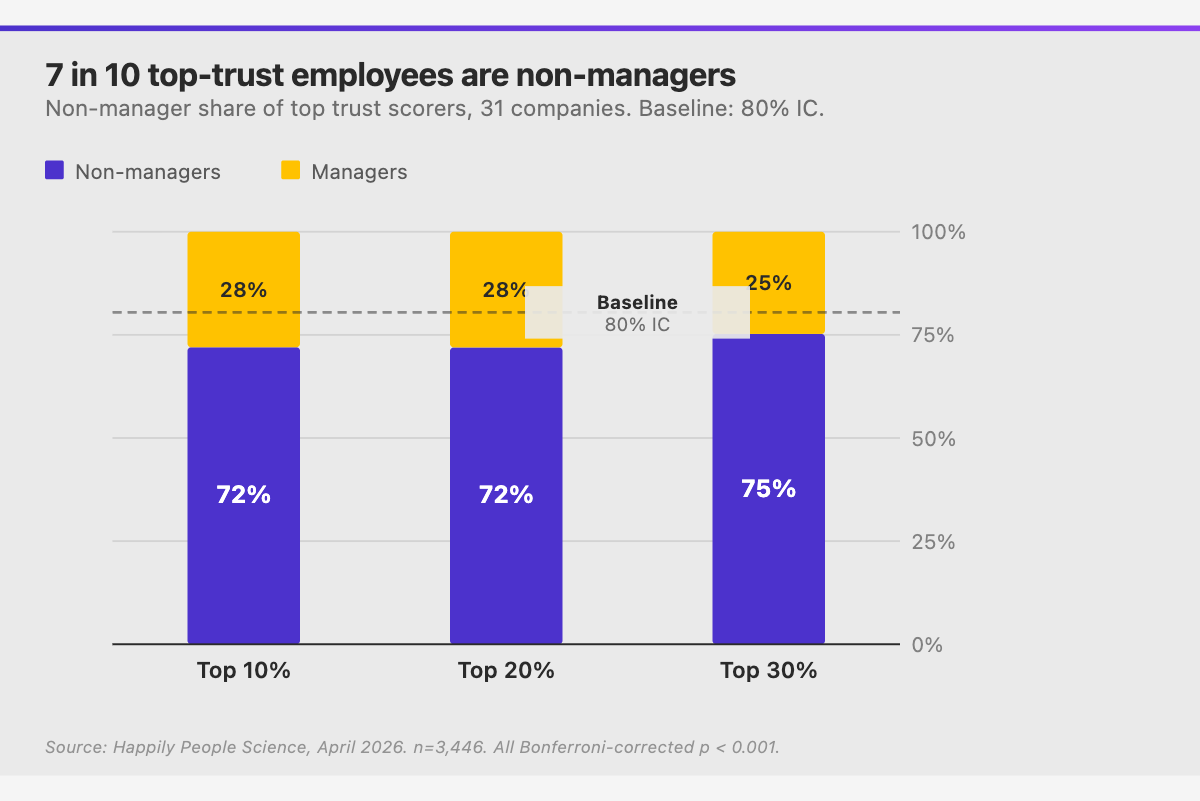
Networks
Trust Networks: The Hidden Influencers
72% of the most-trusted people across 31 companies hold no management title. Mapping the informal influence the org chart misses.
Read the study
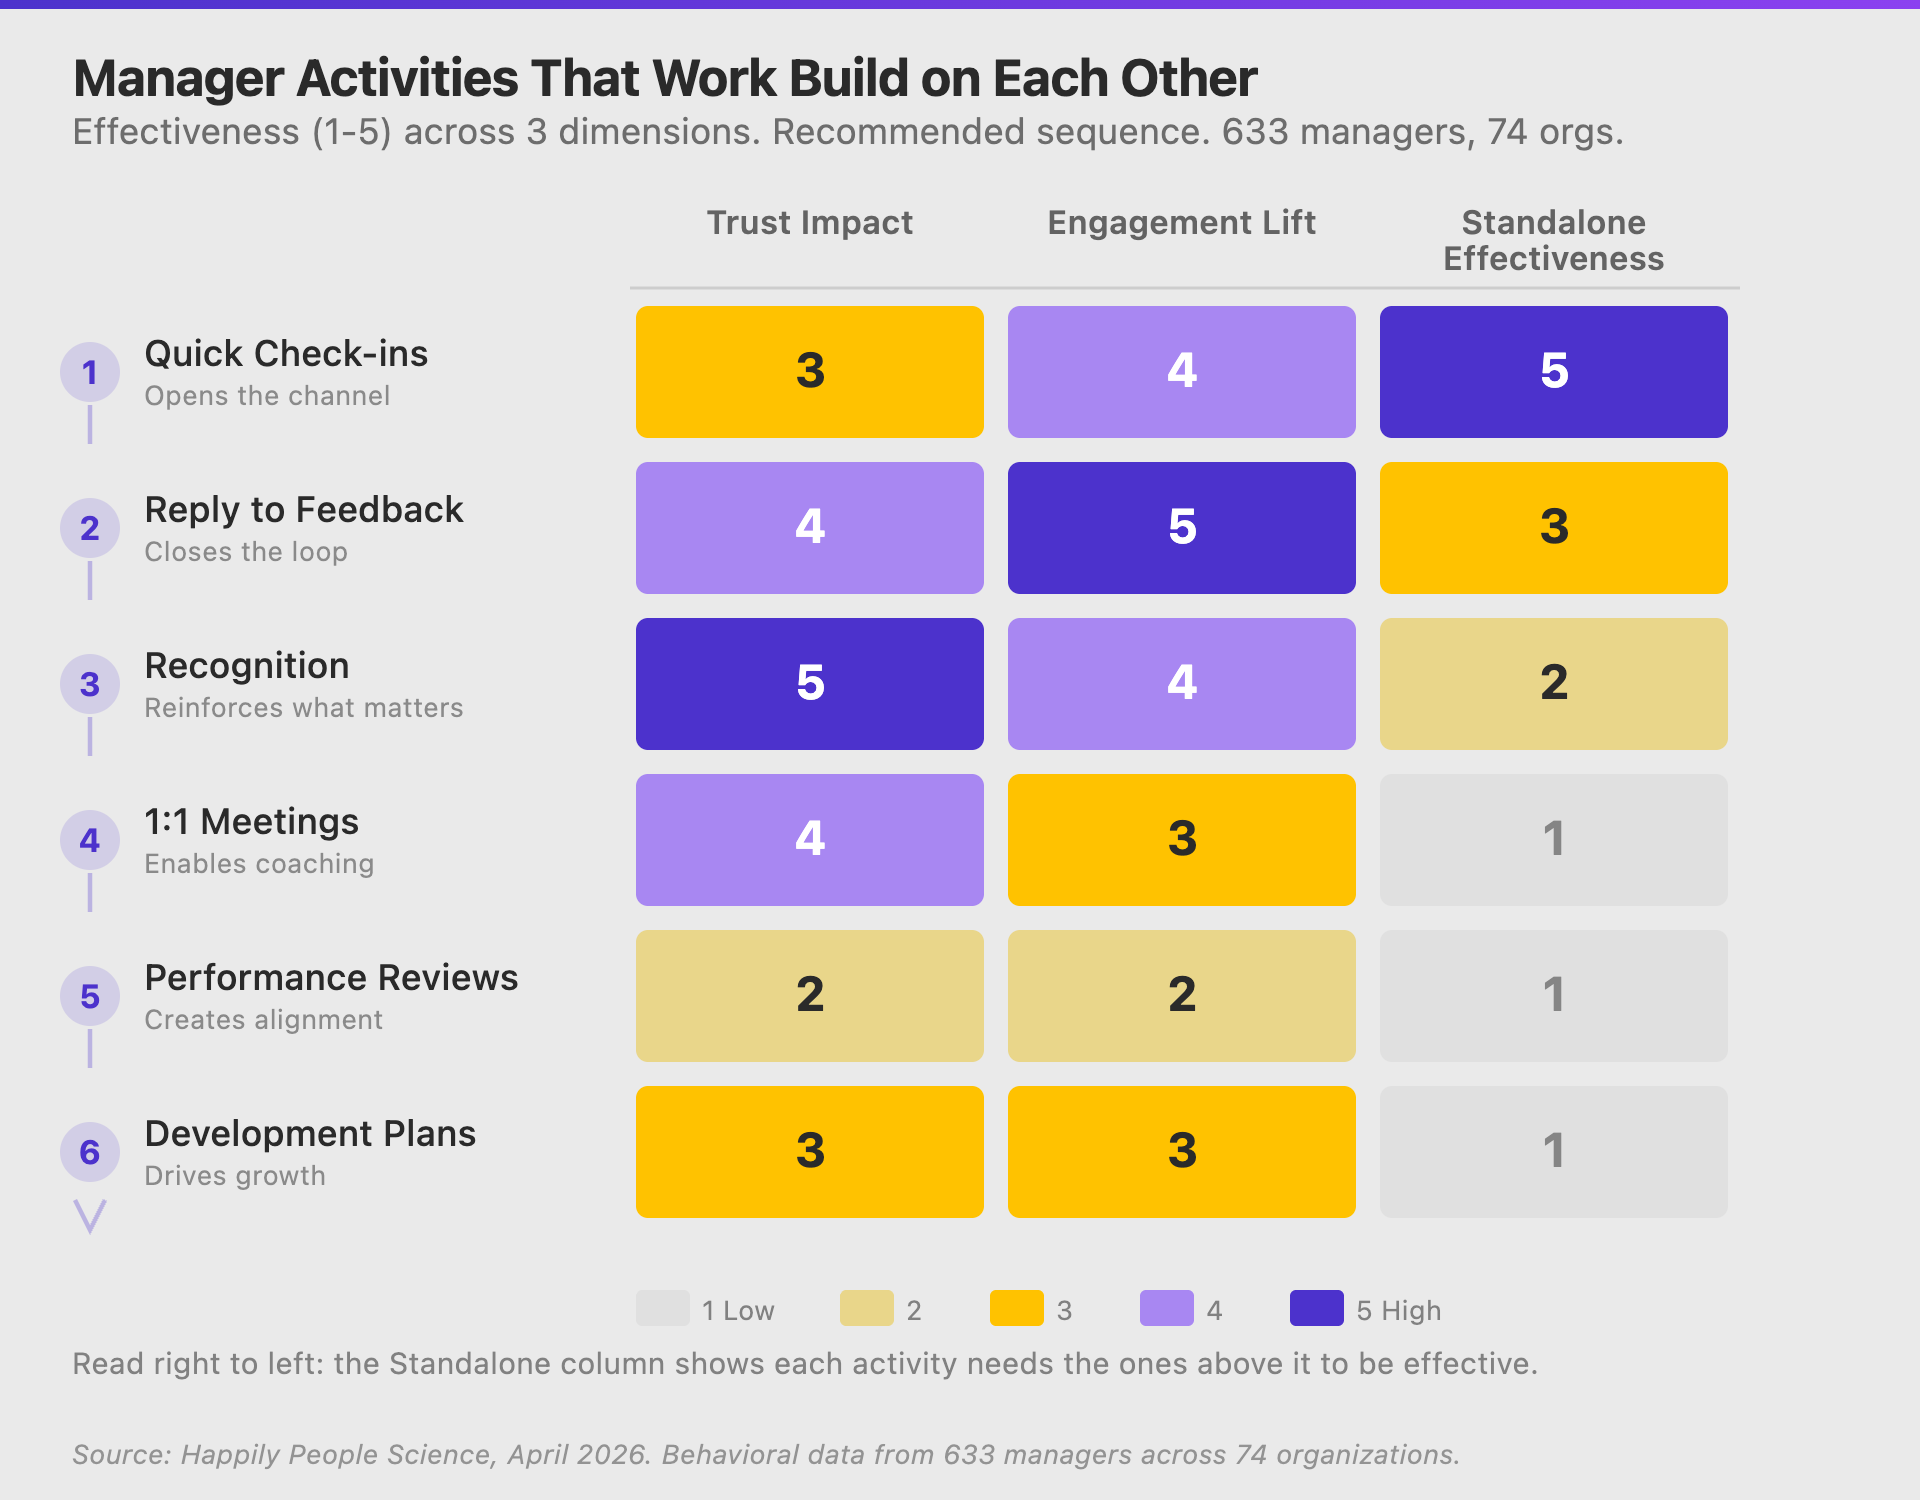
Management
The Manager Activity Sequence
Manager activities build on each other. Do them out of order and effectiveness collapses. The right sequence, from 633 managers.
Read the study
Benchmarks
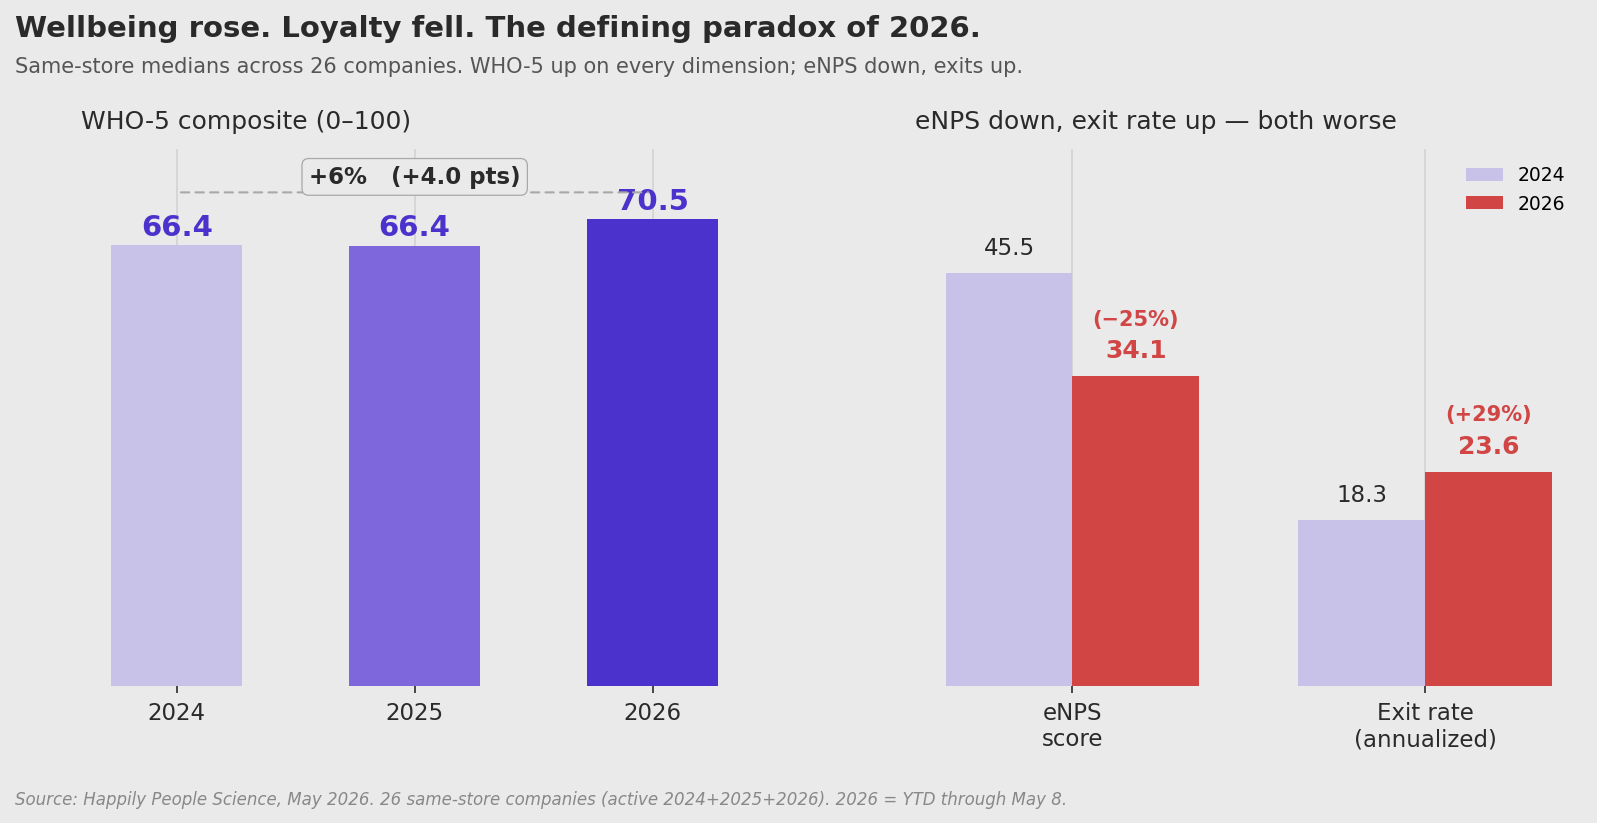
The Well-being Paradox
Across 26 companies, well-being rose while engagement, recognition, and feedback all fell. A year of diverging trends.
Read the study
Retention
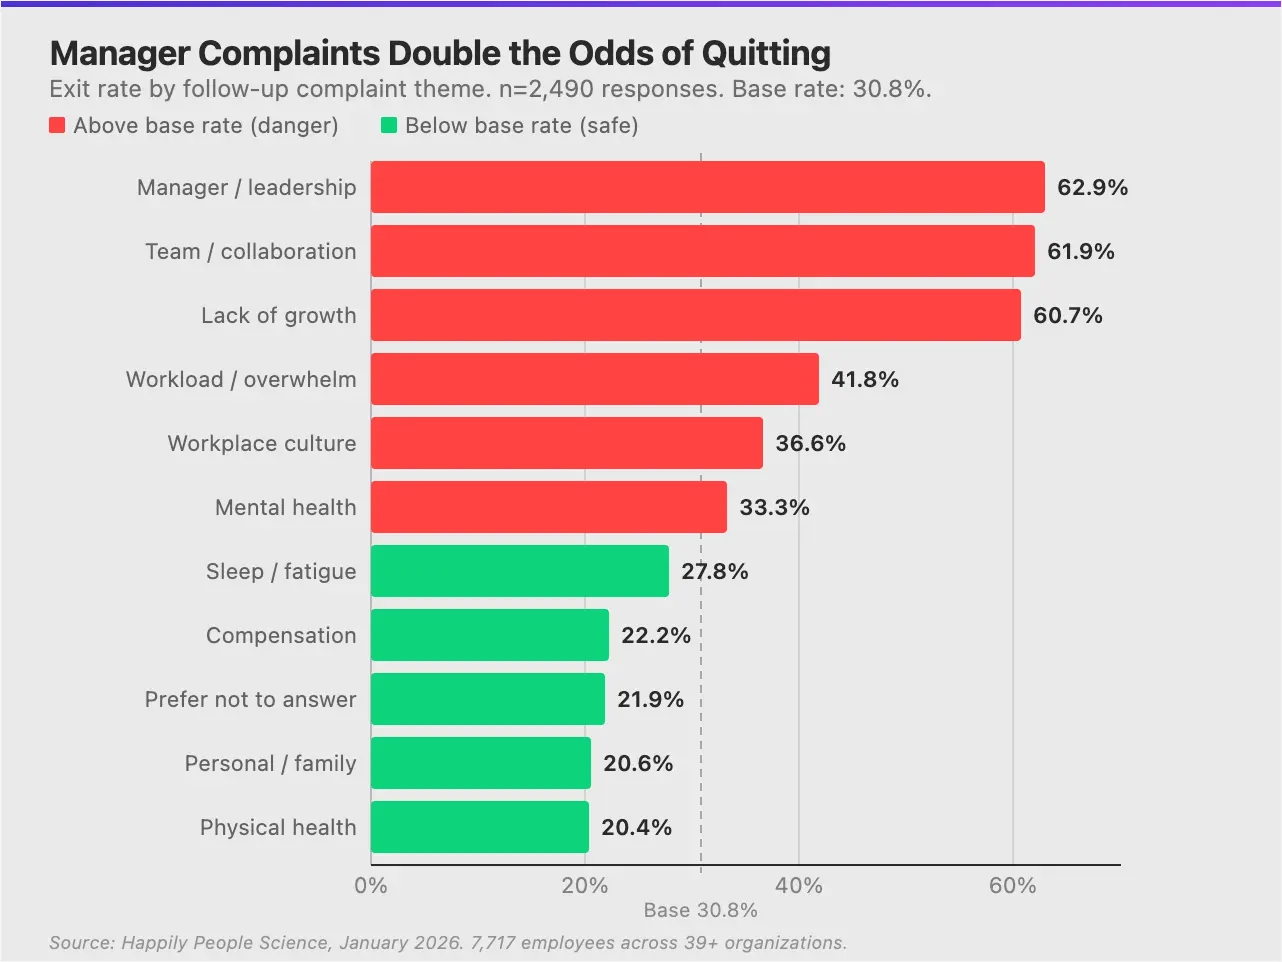
What Employees Complain About Before They Leave
Manager complaints predict a 63% exit rate. Compensation predicts 22%. The warning signs appear 90 days early.
Read the study
Well-being
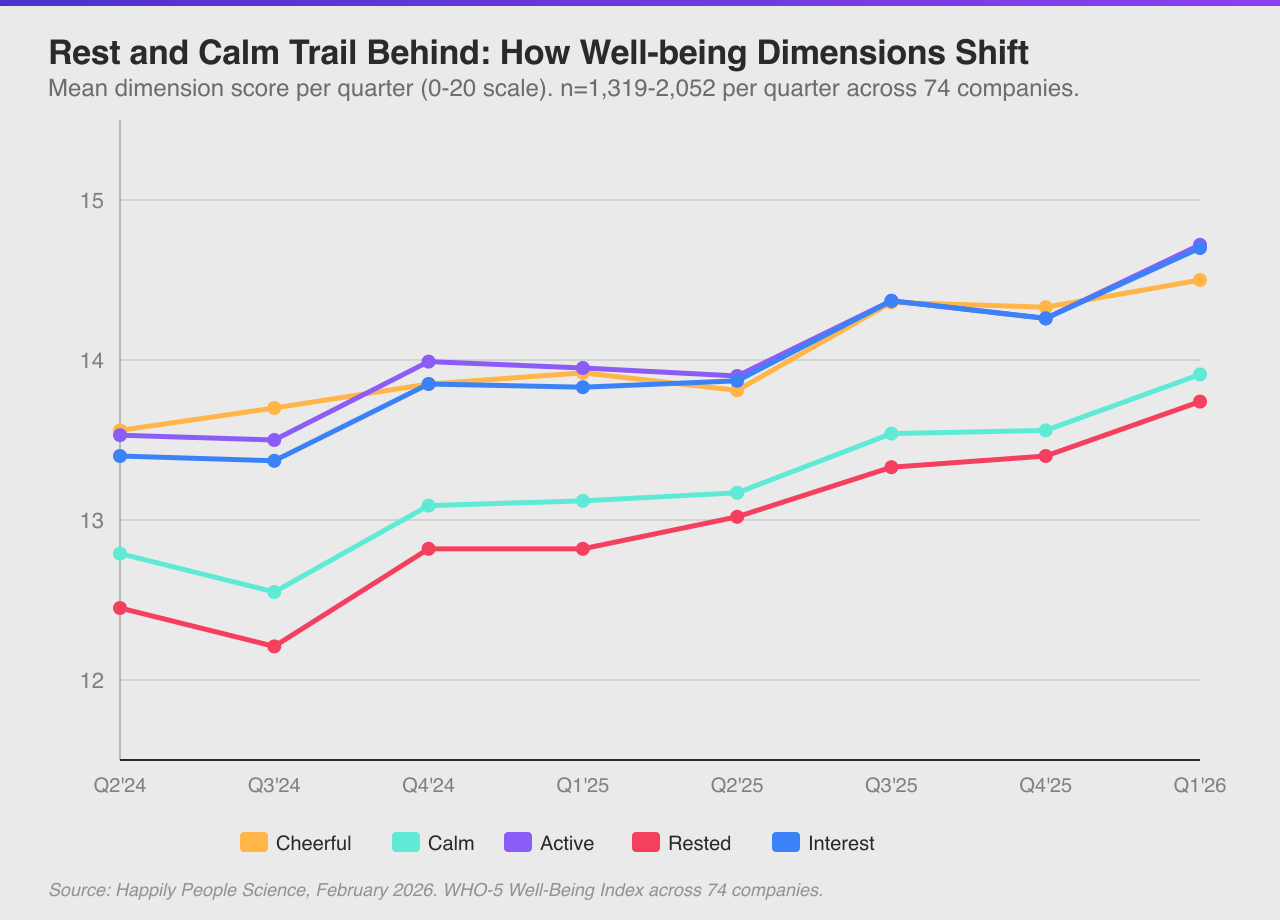
WHO-5 Dimensions: The Bottleneck
Rest and calm are the two dimensions that consistently score lowest across 2,912 employees — the hidden ceiling on well-being.
Read the study
Engagement
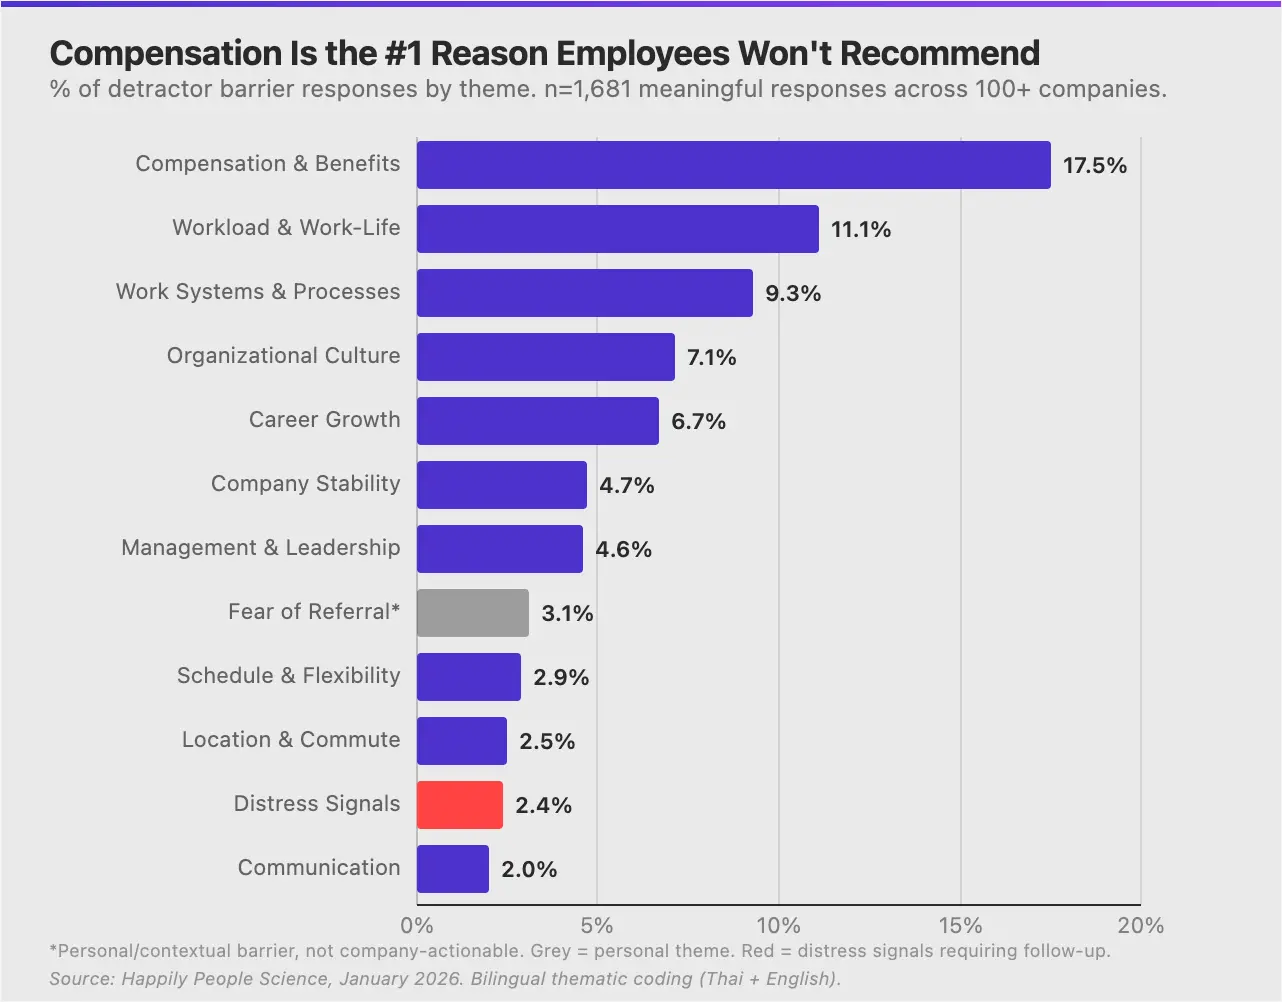
eNPS Barriers: Why They Won't Recommend
Analysis of 34,803 responses reveals the specific barriers that prevent employees from recommending their company.
Read the study
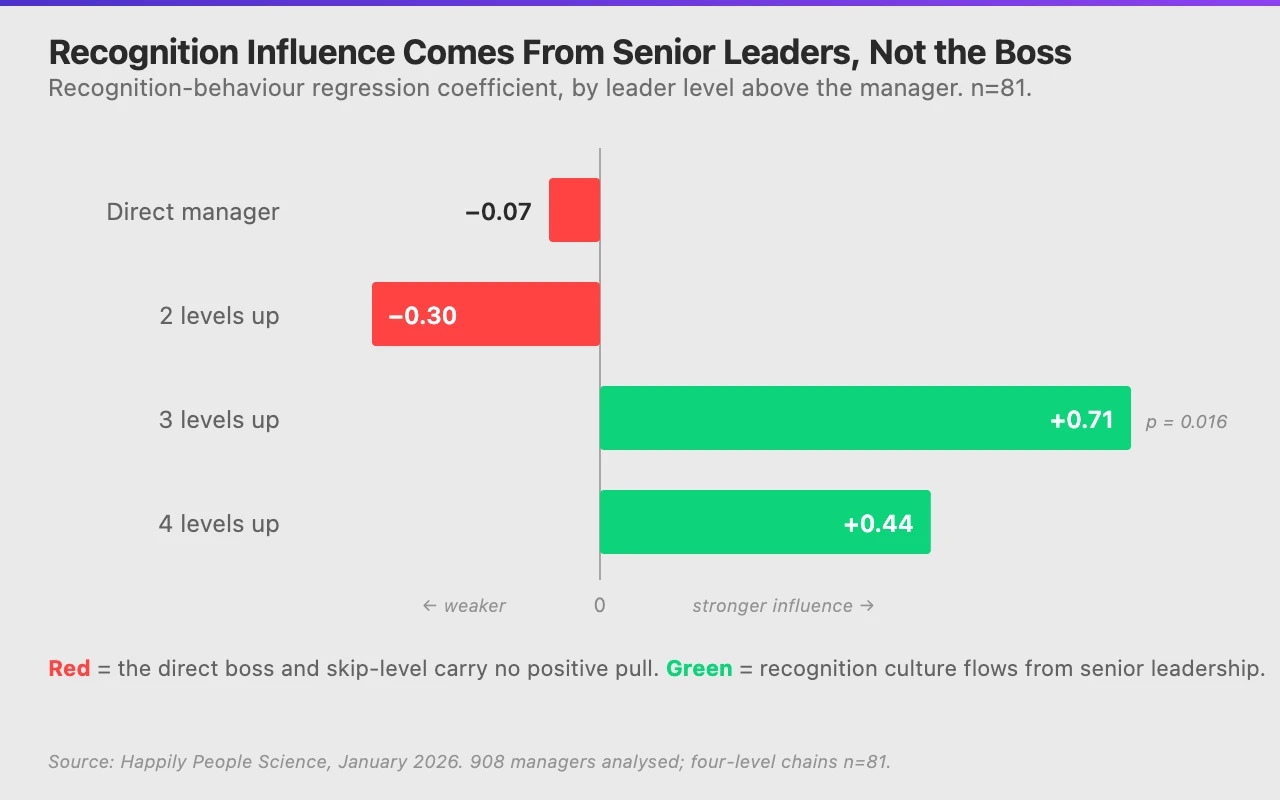
Recognition
The Recognition Cascade
Recognition behaviour does not flow from your direct boss. It flows from senior leaders two levels up. A different cascade than reply behaviour, across 908 managers.
Read the study
Well-being
The Stress Sweet Spot
Well-being follows an inverted-U with stress. Moderate stress beats both calm and overload by 12–18%, across ~2,200 employees.
Read the study
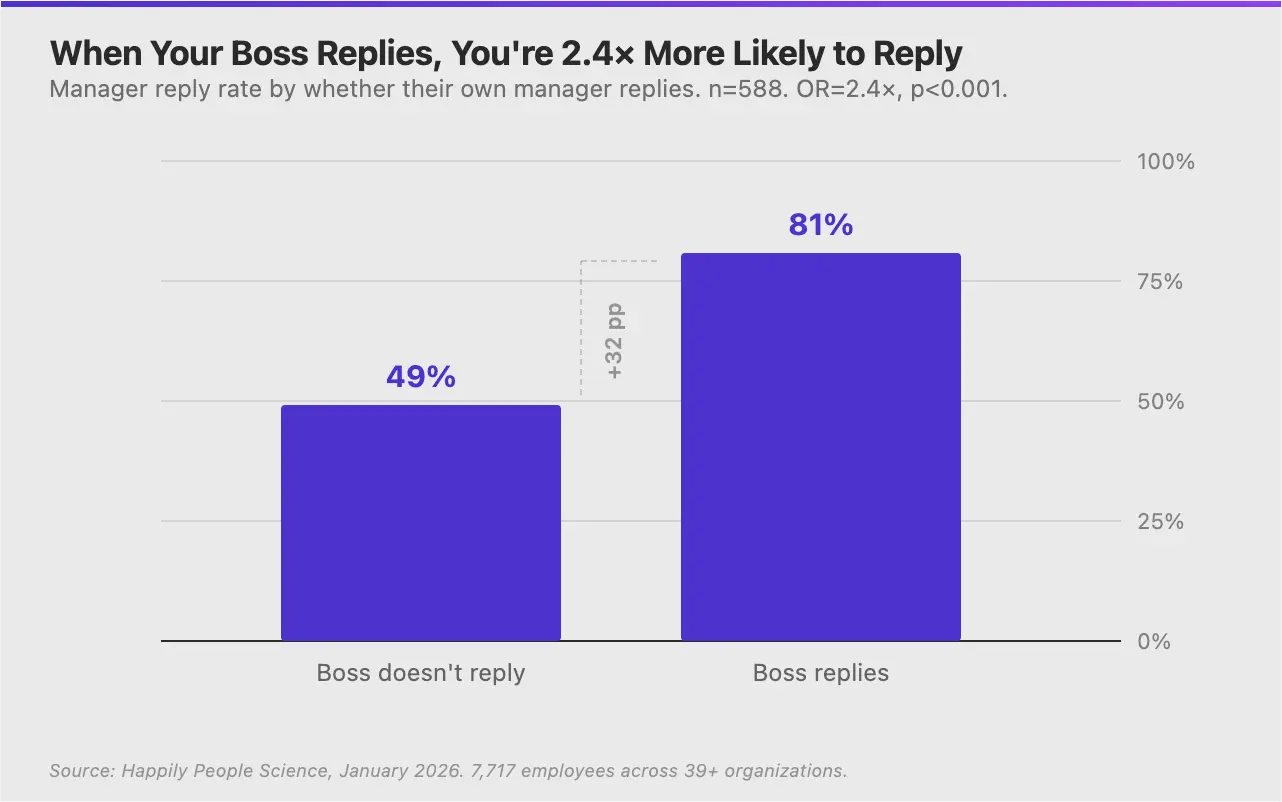
Leadership
The Leadership Cascade
Managers learn reply behaviour from their bosses. The 2.4× multiplier effect that shapes entire org cultures.
Read the study
Retention
The Engaged Exit
The most engaged employees are the highest flight risk. Why satisfaction isn't the same as staying.
Read the study
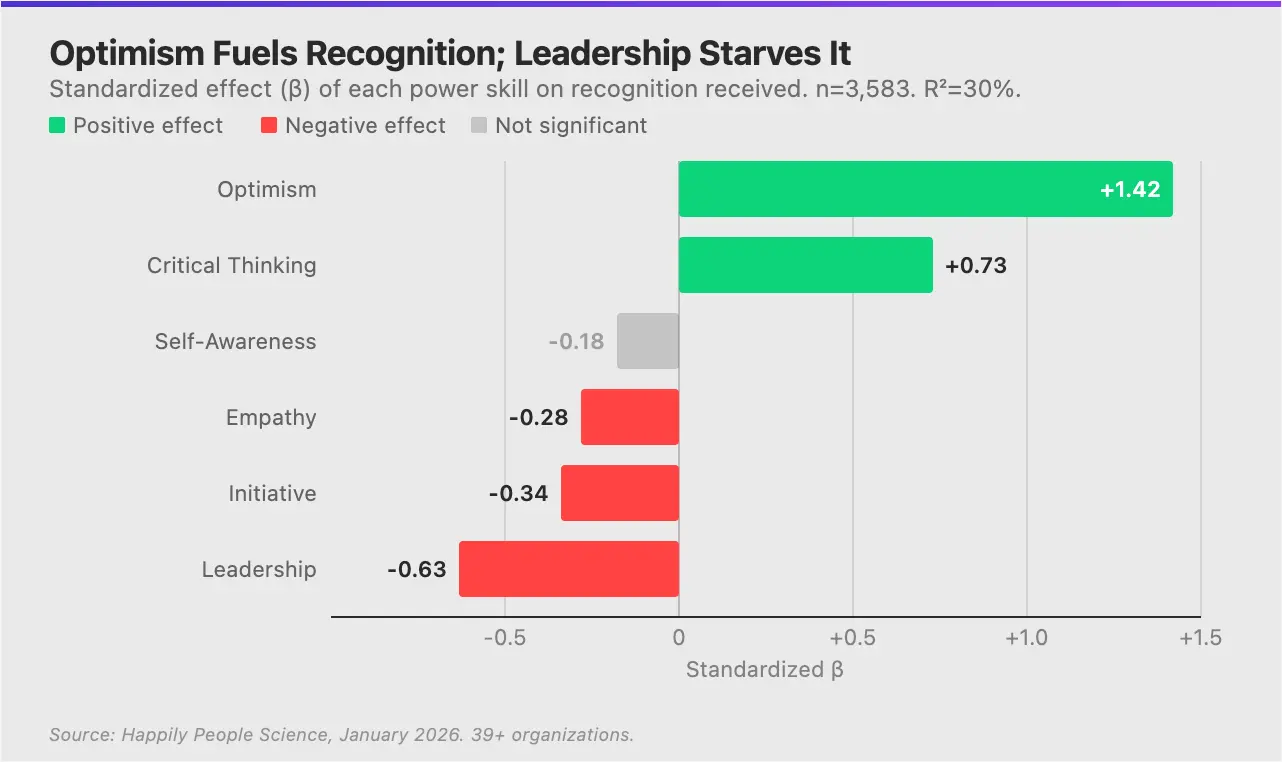
Recognition
Power Skills: What Drives Recognition
Optimism is the skill most strongly associated with receiving peer recognition — not competence or reliability.
Read the study
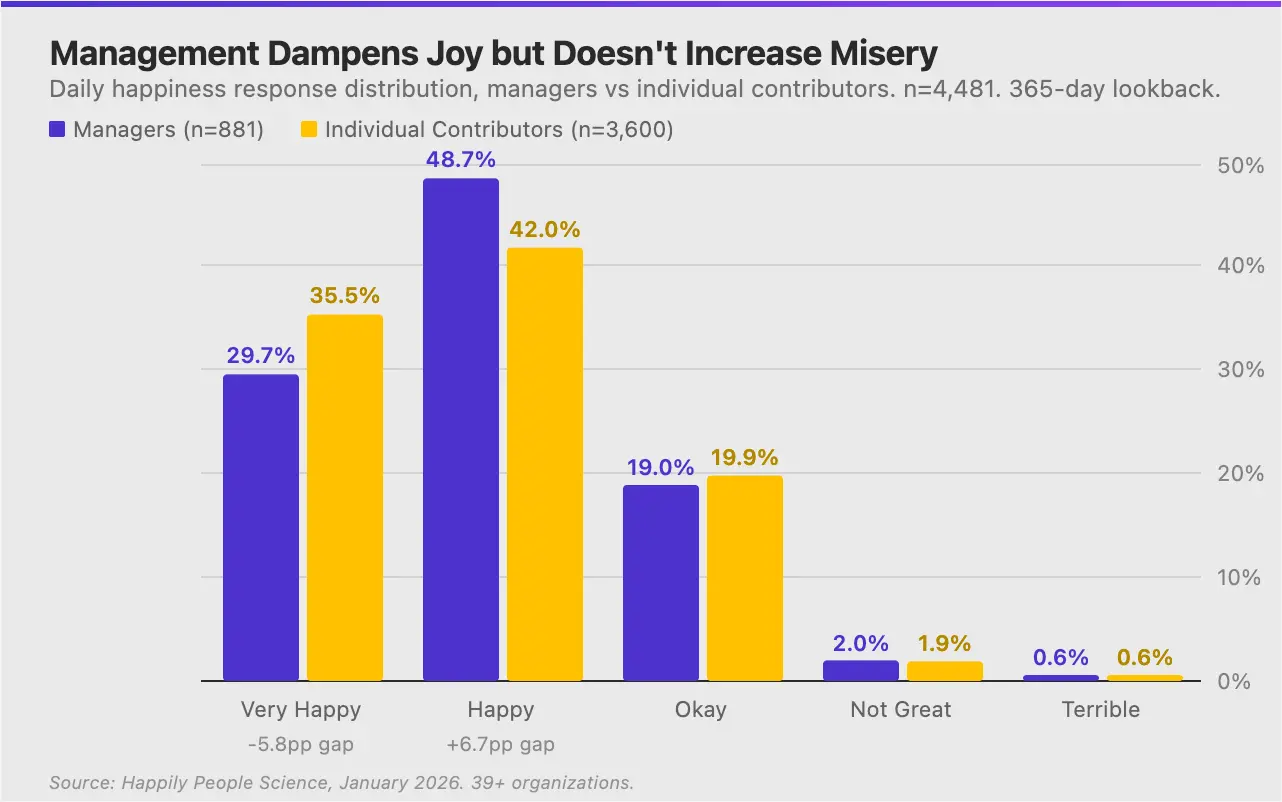
Culture
The Manager Experience Gap
How managers' own happiness shapes the recognition culture of their teams. The distribution tells the story.
Read the study
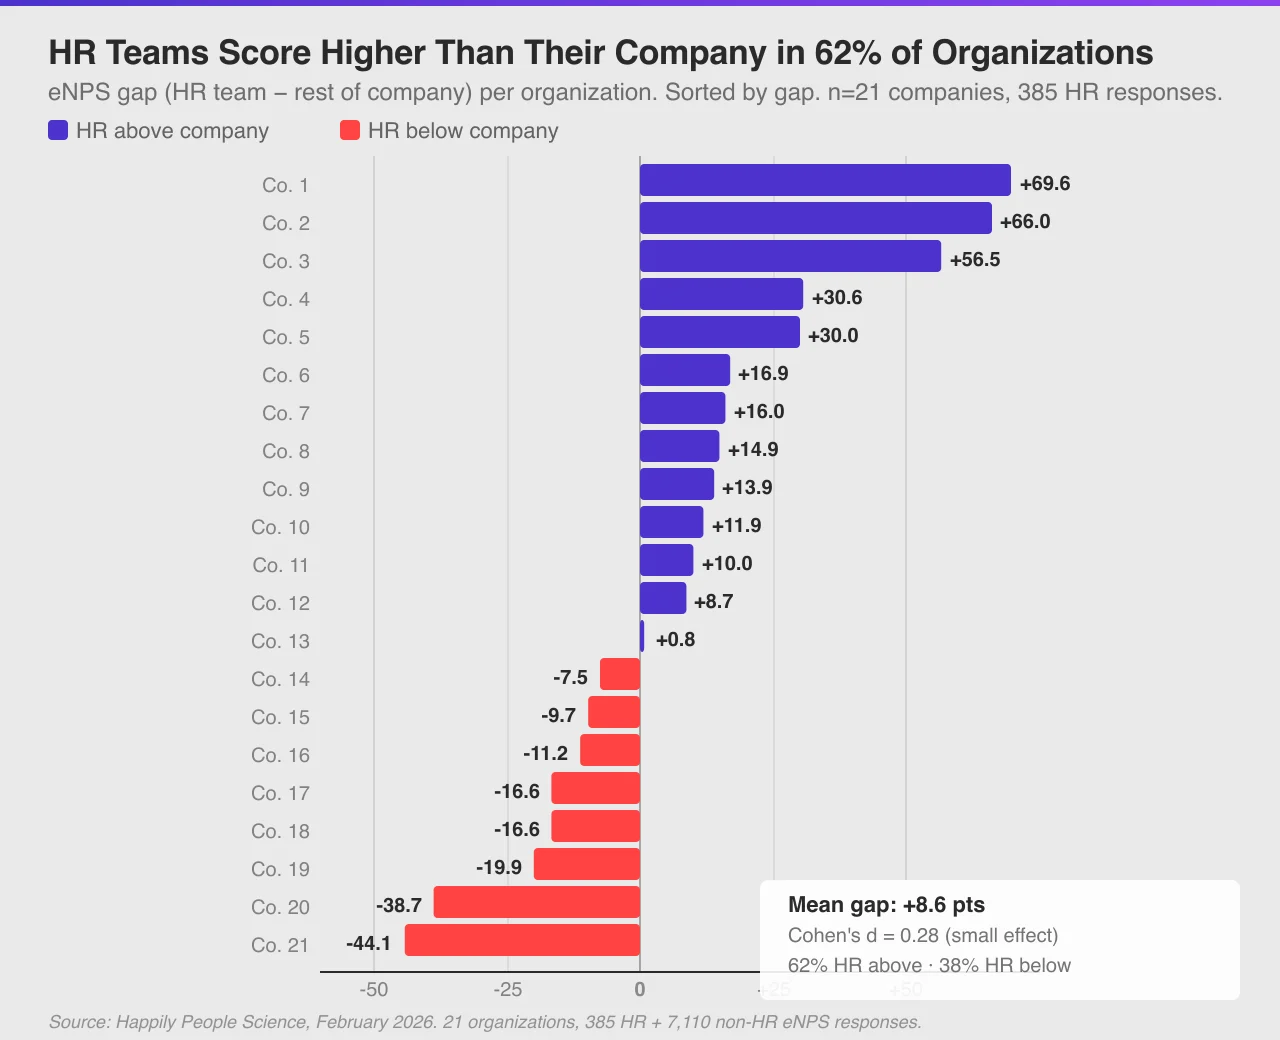
Engagement
HR eNPS: Bellwether or Bubble?
HR teams score 8.6 points higher on eNPS than the rest of the company — but 38% of orgs see the opposite.
Read the study
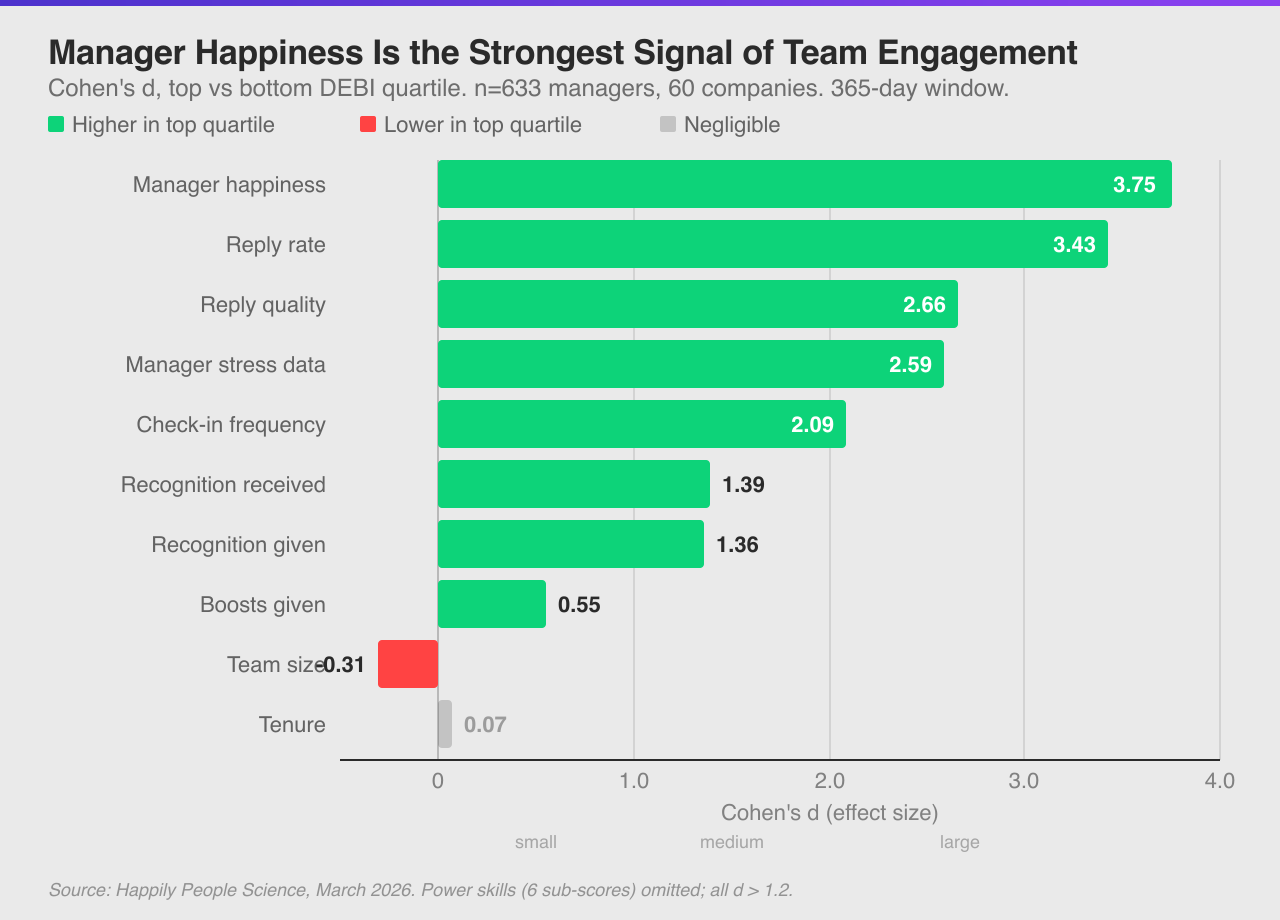
Management
What Actually Drives Team Engagement
A manager's own happiness and reply rate predict team engagement far more than tenure or team size. 633 managers, 60 companies.
Read the study
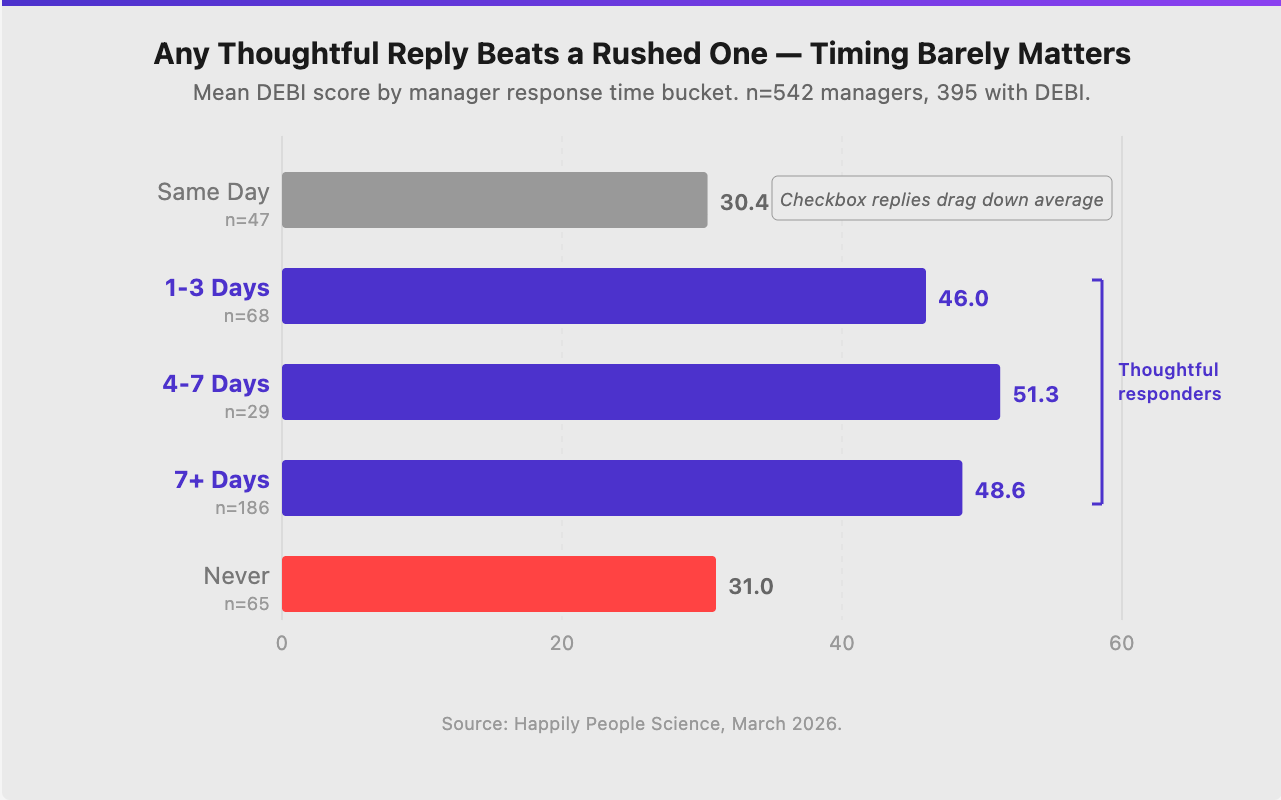
Feedback
Reply Quality Beats Reply Speed
High-quality replies in 1–3 days achieve DEBI 54 vs 29 for rushed same-day replies. 542 managers, 100 companies.
Read the study
Bring these insights
to your team
to your team
Happily turns real-time employee data into actionable people insights — so you can build the culture your team deserves.
Get in touchFree pilot for qualifying teams