The well-being paradox: employees feel better and engagement is collapsing
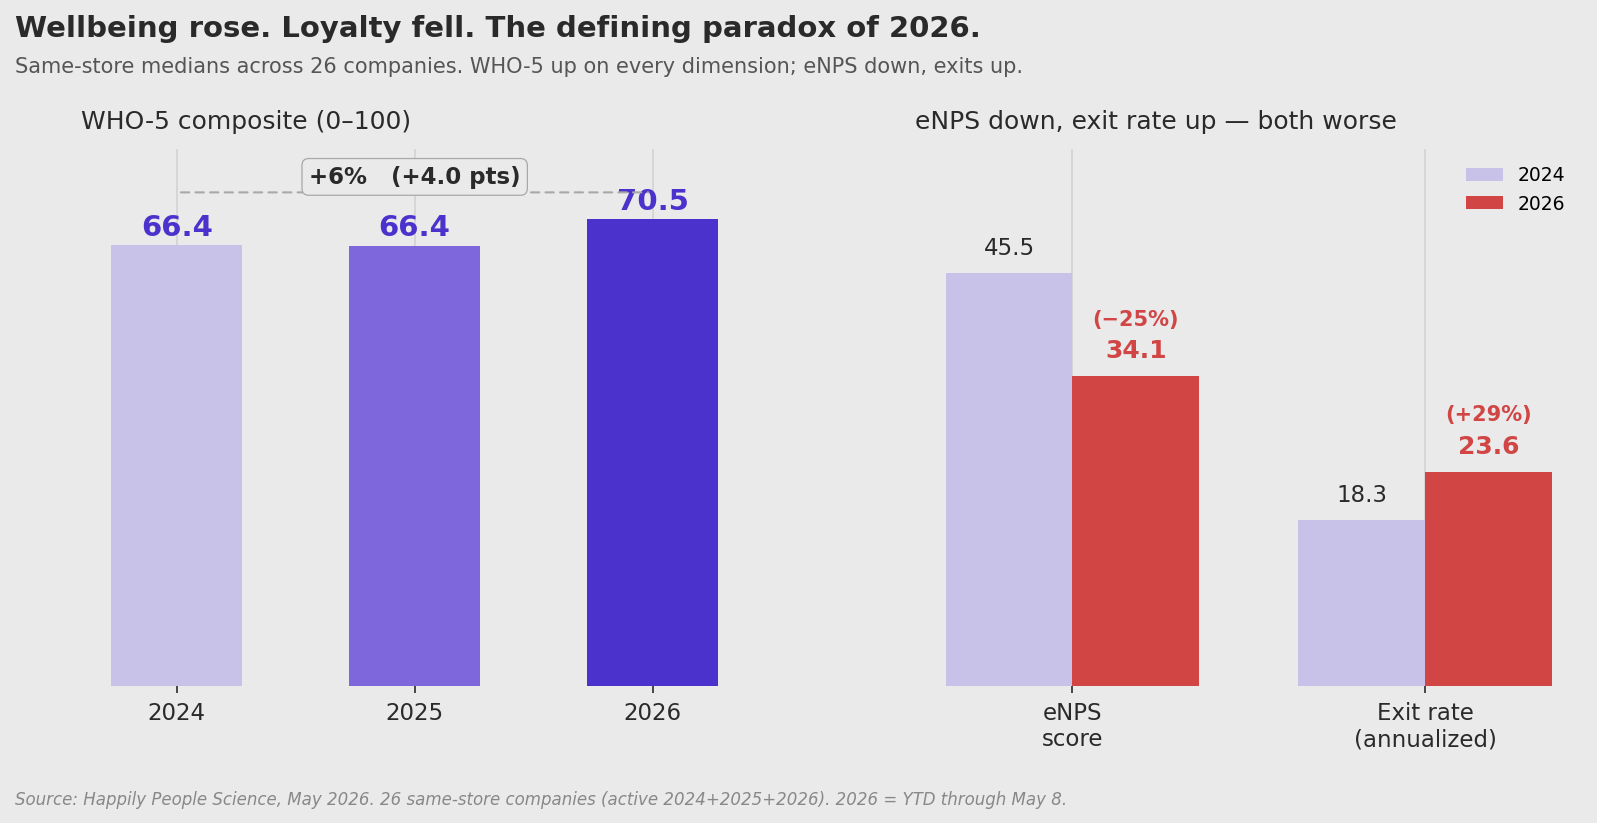
Across 26 companies measured in all three years from 2024 to 2026, WHO-5 well-being reached a three-year high. Almost everything else fell. People are calmer and more rested, yet they answer far less, recognize each other much less, and leave more often.
Most people-analytics dashboards treat well-being as a summary metric. If employees report they feel good, the assumption is the rest of the engagement picture is healthy too. This study tests that assumption directly, and it does not hold.
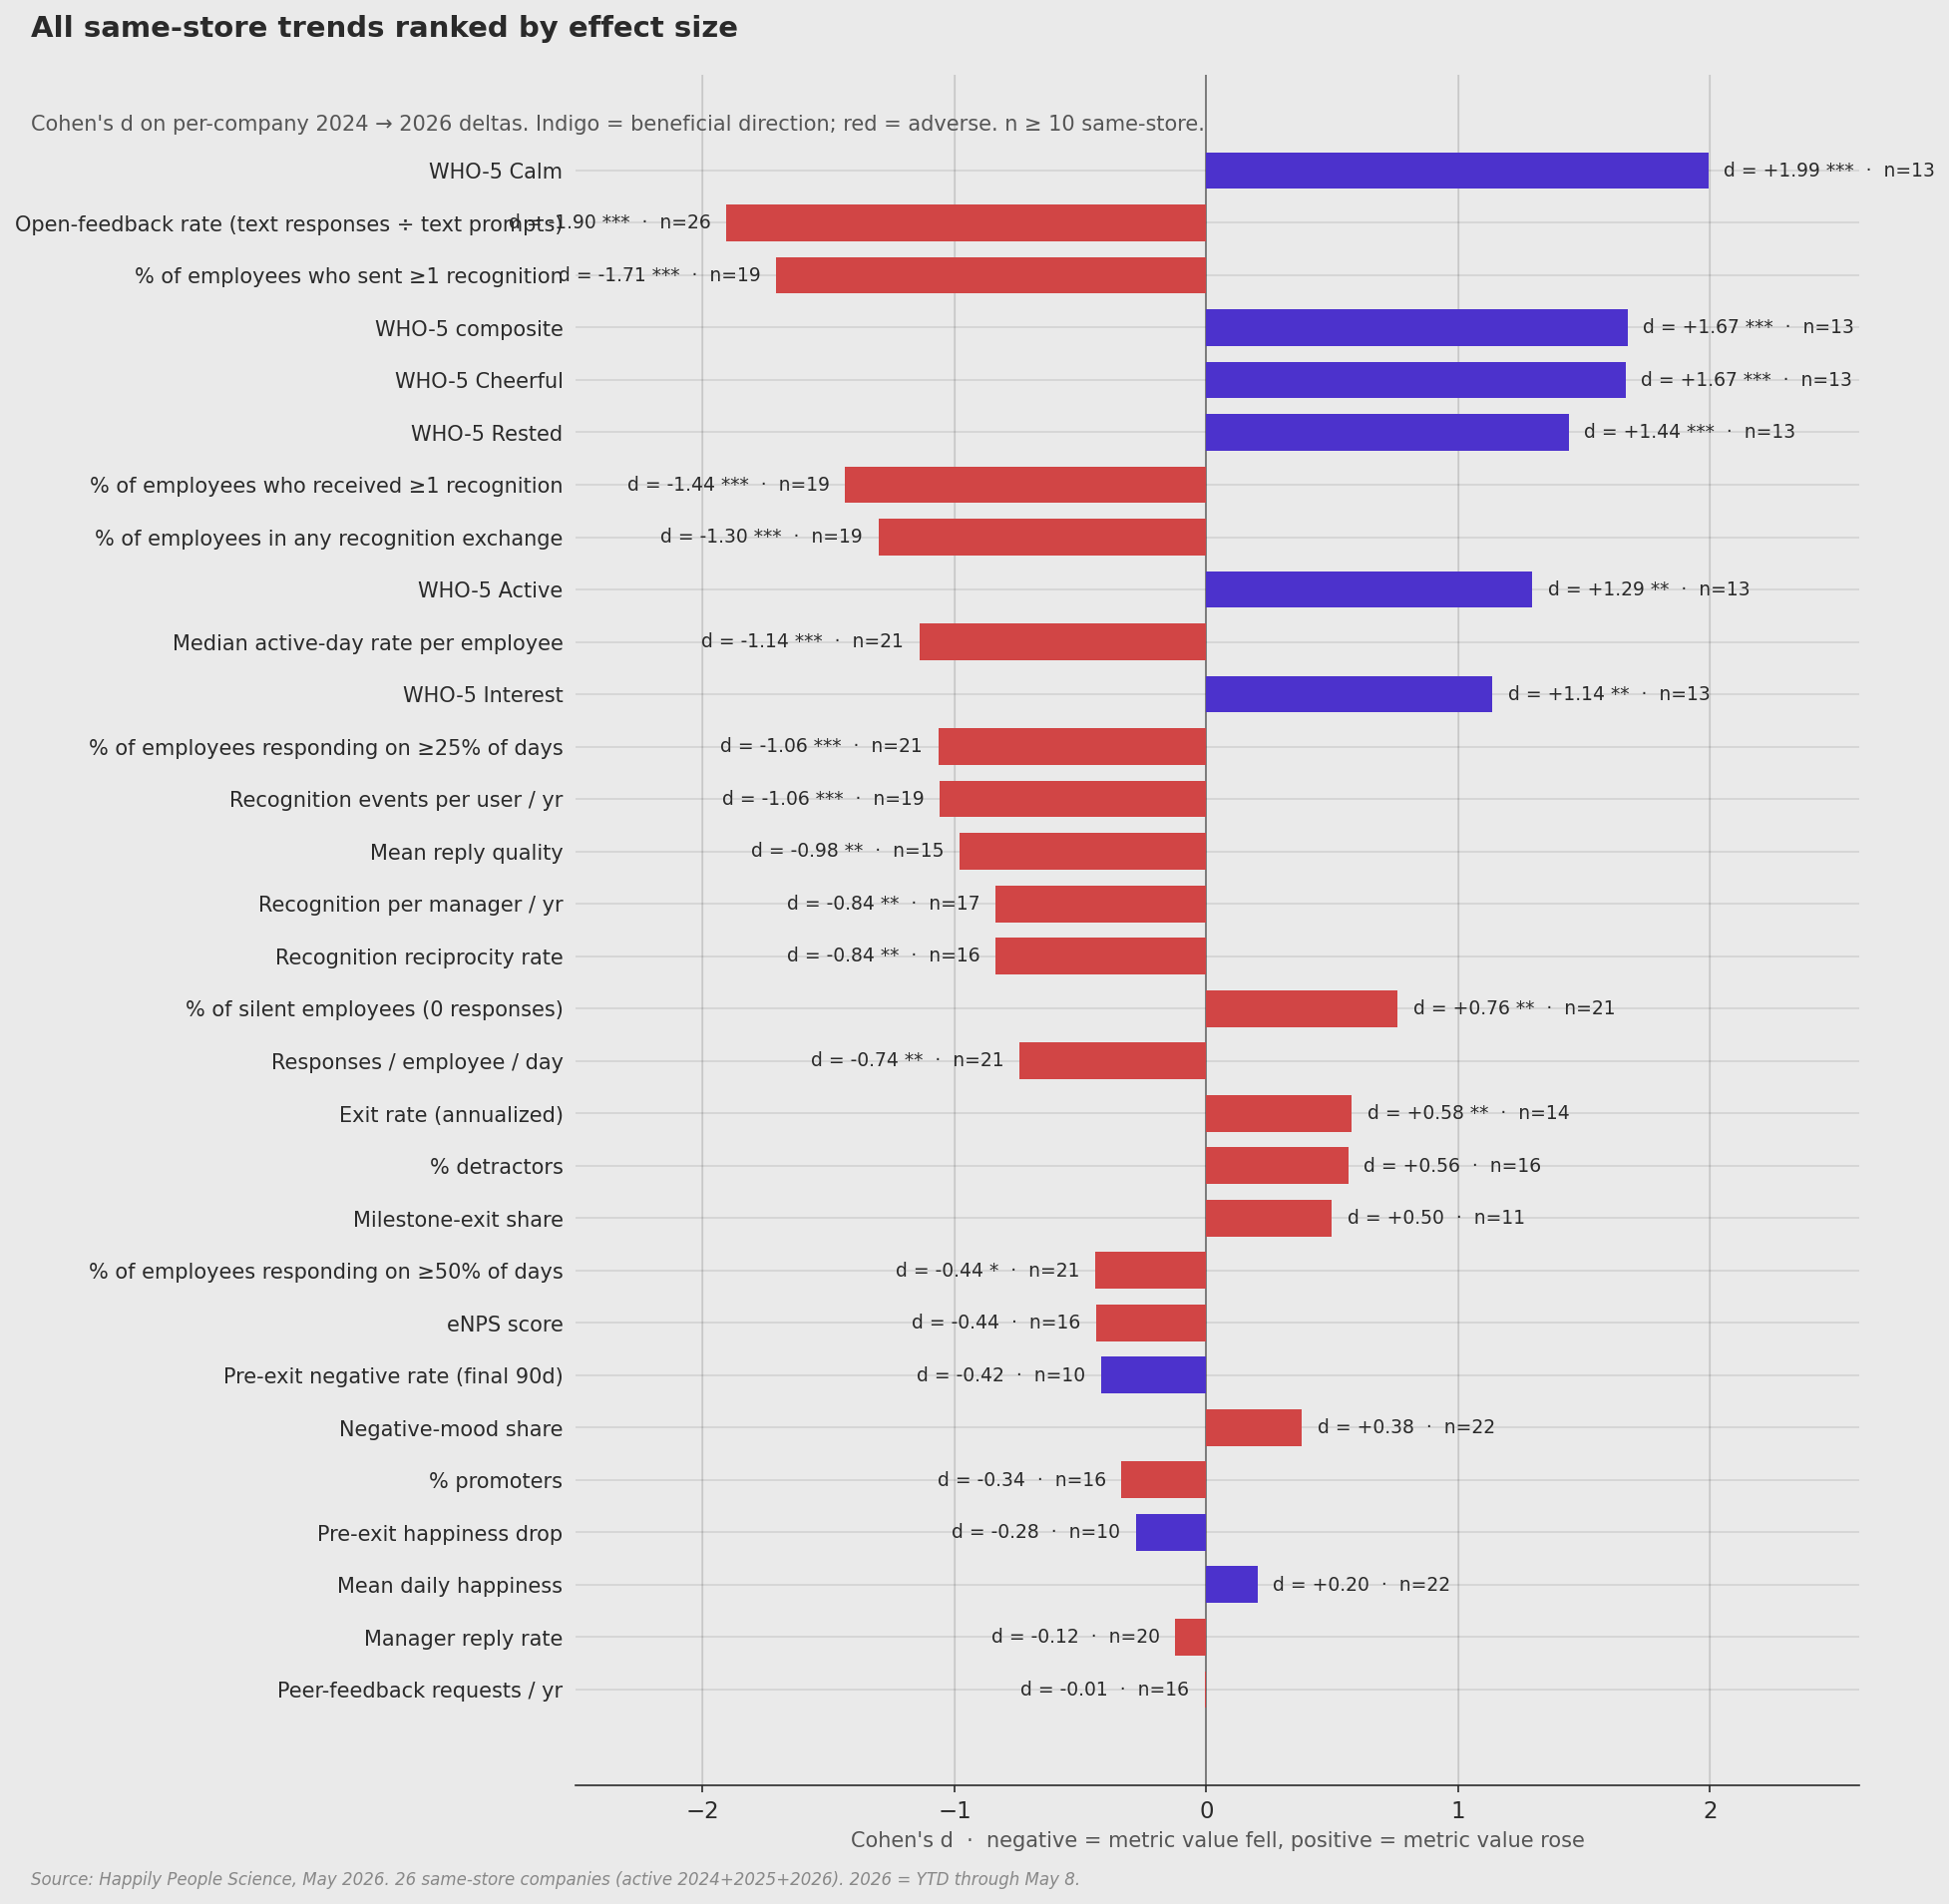
We compared 26 companies that were active on the Happily platform across all three years from 2024 to 2026. For these "same-store" companies the customer mix is held constant, so any movement reflects how the experience changed inside existing customers rather than a shift in who the customers are. The result is a sharp split. WHO-5 well-being rose +6% and every subdimension improved. At the same time, open feedback fell 75%, recognition participation fell by a third to a half, employee response consistency fell 80%, manager reply rate fell 24%, eNPS slipped 25%, and exits rose 29%.
Employees feel calmer and more rested day-to-day. They are also answering less, recognizing each other less, getting fewer manager replies, and leaving more. Well-being and engagement have moved in opposite directions.
Customer health stories and HR scorecards routinely use well-being as a green light. This data shows well-being measures something orthogonal to engagement and retention. A rising WHO-5 score is a real win, but it does not tell you whether people are still participating in feedback, recognition, or whether they intend to stay.
How we measured the change
The study window runs from January 1, 2024 to May 8, 2026. 2024 and 2025 are full calendar years; 2026 is year-to-date, 128 days. Rate and mean metrics (eNPS, WHO-5, reply rate, exit rate) are scale-invariant and compared directly. Volume metrics (recognition events, peer-feedback requests) are annualized by scaling the raw count to a 365-day equivalent.
boss field — true reporting lines, not a job-title flag.An earlier draft of this study counted every prompted question as a response. Every issued question creates a row whether or not the employee answered it, and most rows are unanswered: 62% of multiple-choice rows and 85% of text-area rows have no real answer. All response-side metrics have been recomputed to count answered rows only.
The correction matters. The earlier draft reported active-day rate flat near 70% and pulse volume up +163%; the corrected figures show active-day rate falling 27% to 5.5% and per-employee response volume falling 25%. The figures in this article are the corrected ones.
The platform issued roughly three times as many questions in 2026 as in 2024. That higher issuance is why an uncorrected count looked like engagement growth. Once you count only the questions employees actually answered, the direction reverses.
Finding 1 — Well-being rose on every dimension
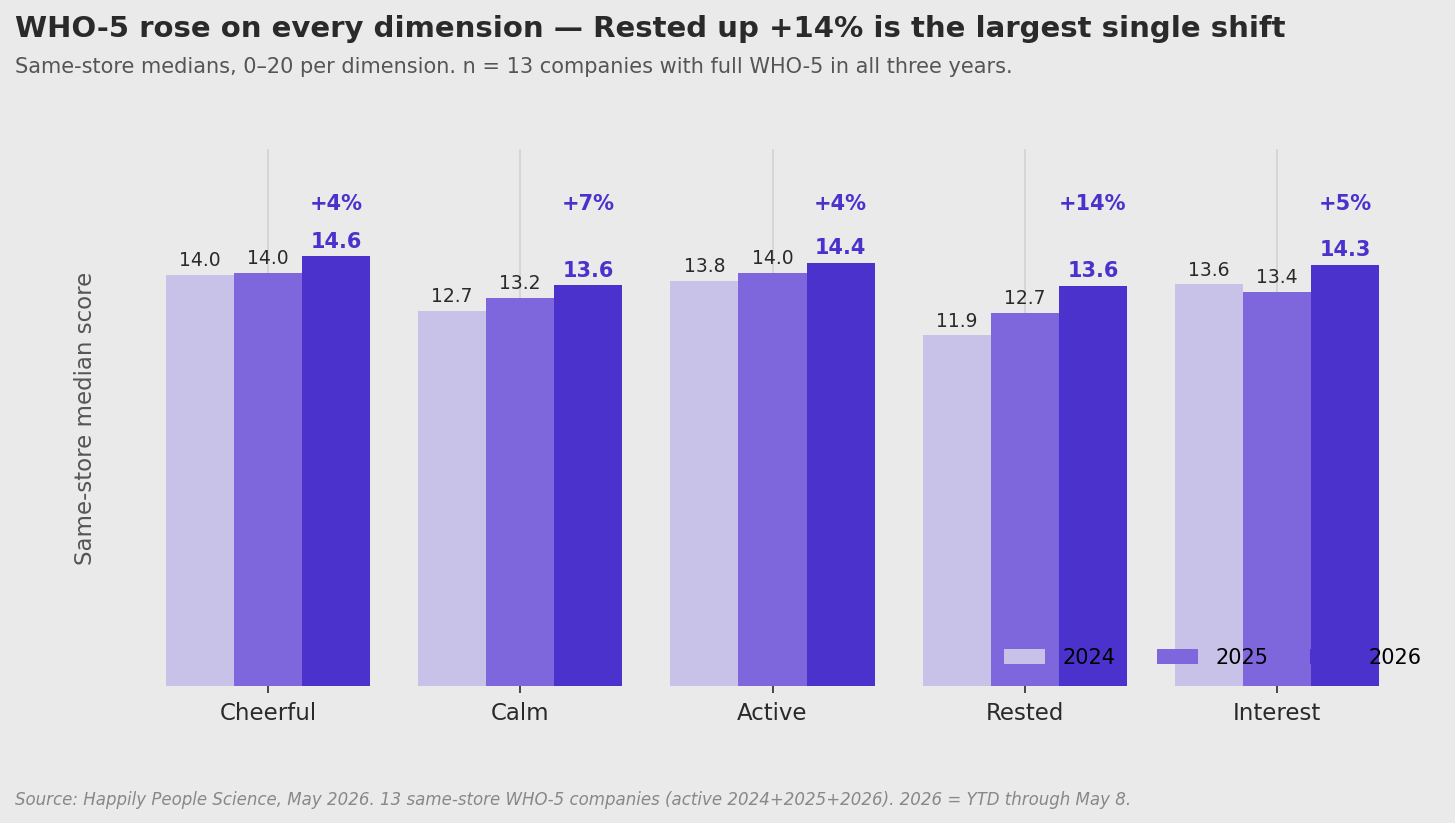
The same-store WHO-5 composite rose from 66.4 to 70.5 on a 0–100 scale, a +6.0% gain (Cohen's d = 1.67, p = 0.0005). 92% of same-store companies improved. All five subdimensions moved in the same direction.
The largest single shift is Rested, up +14.2% from a median of 11.9 to 13.6 on its 0–20 scale. Every same-store company improved on Rested — 100%, the only metric in the study with unanimous directional movement. Calm shows the strongest effect size in the study (d = 1.99), rising +6.8%. Together they point to a decompression theme: employees feel more rested and calmer day-to-day than they did two years ago.
| Metric | 2024 | 2026 | % chg | Cohen's d | % improving |
|---|---|---|---|---|---|
| WHO-5 composite (0–100) | 66.4 | 70.5 | +6.0% | 1.67 | 92% |
| WHO-5 Rested | 11.9 | 13.6 | +14.2% | 1.44 | 100% |
| WHO-5 Calm | 12.7 | 13.6 | +6.8% | 1.99 | 92% |
| WHO-5 Interest | 13.6 | 14.3 | +5.0% | 1.14 | 85% |
| WHO-5 Cheerful | 14.0 | 14.6 | +4.4% | 1.67 | 92% |
| WHO-5 Active | 13.8 | 14.4 | +4.4% | 1.29 | 92% |
| Mean daily happiness (1–5) | 3.93 | 4.06 | +3.2% | 0.20 | 68% |
The all-customers cohort tells the same story (64.6 → 68.8), so this is not a same-store artifact. The well-being gain is the most cohort-stable finding in the study, and it is a genuine win.
The eNPS result breaks from that pattern. While daily-mood metrics rose, same-store eNPS fell from 45.5 to 34.1, a 25% drop. The Wilcoxon test is borderline (p = 0.13), so this is a yellow flag rather than a confirmed result, but the direction is wrong. The decomposition shows promoter erosion is doing the work: the promoter share fell from 55% to 48%, while detractors only rose from 10% to 11%. Employees feel better day-to-day but are less likely to recommend their employer. Mood and advocacy have separated.
Finding 2 — Open feedback and recognition collapsed
The engagement dimension is where the steepest declines sit. The single largest effect in the study is the open-feedback rate: among text-prompts that were actually issued, the share that received a real written answer fell from 17.5% in 2024 to 4.3% in 2026, a 75% relative decline (Cohen's d = −1.90, p < 0.0001). Every same-store company declined. This is computed against the correct denominator — text prompts only, not all question rows.
The fall is steady across the three years (17.5% → 10.0% → 4.3%), not a 2026 cliff. By 2026, 96% of issued text prompts get no real written response. The information density of the qualitative feedback stream has fallen sharply.
The 75% drop is in the response rate per text prompt, not the count of prompts. The platform issues more text prompts than ever. Employees write into a far smaller share of them. When a channel gets 96% non-response, the prompts are spending employee attention without returning information.
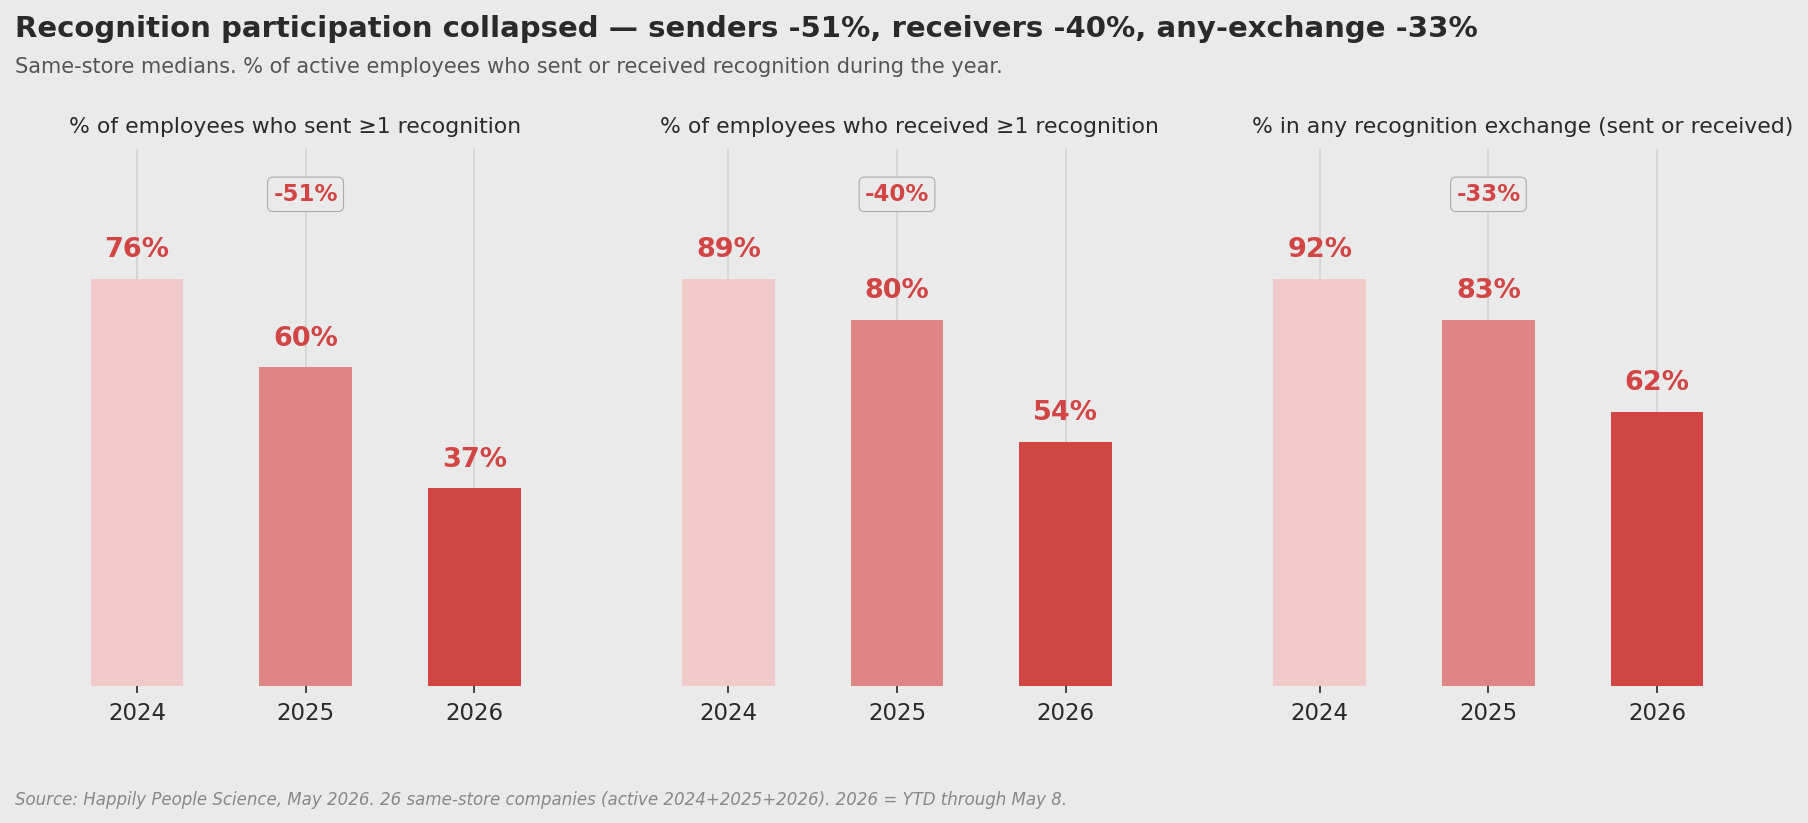
Recognition participation fell across every cut. Recognition is reported here as a participation rate — the share of active employees who sent or received at least one recognition during the year — which is a culture measure rather than a throughput measure.
| Metric | 2024 | 2026 | Δ | Cohen's d | % declining |
|---|---|---|---|---|---|
| Sent ≥1 recognition | 76% | 37% | −51% | −1.71 | 100% |
| Received ≥1 recognition | 89% | 54% | −40% | −1.44 | 100% |
| In any recognition exchange | 92% | 62% | −33% | −1.30 | 100% |
The sender side fell hardest. In 2024, 76% of employees sent at least one recognition; in 2026, 37% did. That means 63% of employees sent zero recognitions in 2026, against 24% two years earlier. The any-exchange measure — the most permissive, covering anyone who touched recognition in either direction — still fell from 92% to 62%. About a third of the workforce is no longer in the recognition surface at all.
Among the people who do still participate, per-capita volume also fell: recognition events per active user dropped 61%, from a median 9.1 to 3.5 per year. Reciprocity (pairs where both directions occurred) fell from 21% to 14%. Recognition is now a participation problem — most people have stopped, not just slowed down.
Response consistency fell 80%
The median active-day rate — the share of payroll days the median employee actually answered something — fell from 27% in 2024 to 5.5% in 2026, an 80% collapse (Cohen's d = −1.14, p = 0.0002). 90% of same-store companies declined. 2025, a full year, already showed 14%, so this is not a 2026-only artifact.
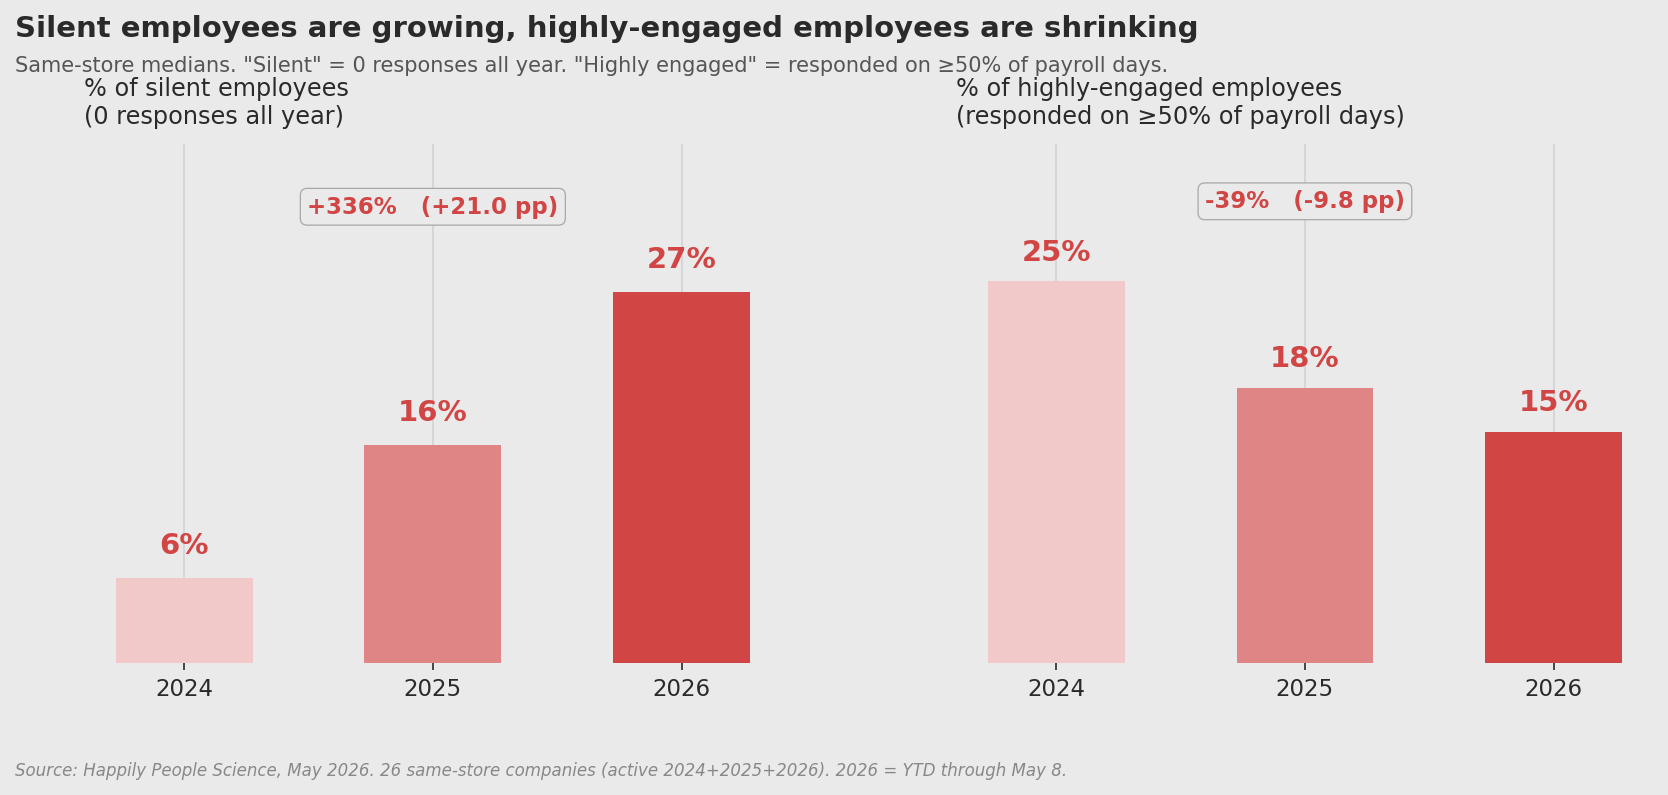
The distribution shifted hard at both ends. The silent share — employees who answered nothing all year — rose from 6% to 27%, more than a fourfold increase and the largest relative shift in the study. The highly-engaged share (answering on at least 50% of payroll days) fell from 25% to 15%.
| Metric | 2024 | 2025 | 2026 | Δ24→26 | Cohen's d |
|---|---|---|---|---|---|
| Median active-day rate | 27% | 14% | 5.5% | −80% | −1.14 |
| Silent employees (0 responses) | 6% | 16% | 27% | +336% | +0.76 |
| Highly-engaged (≥50% of days) | 25% | 18% | 15% | −39% | −0.44 |
| Responses per employee per day | 0.85 | 0.79 | 0.66 | −25% | −0.74 |
| Open-feedback rate | 17.5% | 10.0% | 4.3% | −75% | −1.90 |
The cleanest one-line summary of the 2026 engagement picture is that issuance went up and answers went down. The 2026 active-day rate carries a caveat: it is computed from 128 days year-to-date. The metric is a rate, normalized by payroll days, so the comparison is honest in principle, but seasonal clustering of responses could bias it by a few points either way. The 2025 full-year value of 14% confirms the collapse is real regardless.
Finding 3 — Manager replies thinned in rate and quality
Same-store manager reply rate fell from a median 24% in 2024 to 13% in 2025, then partially rebounded to 18% in 2026 — a non-monotonic path with a sharp 2025 trough. The 24% net decline is not statistically distinguishable on the paired test (Cohen's d = −0.12, p = 0.65) because per-company shifts are noisy, but 60% of companies declined and the direction matches every other engagement metric.
Reply quality is the clearer manager finding. Mean reply quality (the totalres score, 0–100) fell from 81.9 to 67.4, a 17.7% decline (Cohen's d = −0.98, p = 0.007). 93% of same-store companies declined. Most of the damage happened between 2024 and 2025 (82 → 69); 2026 consolidated the lower baseline. Managers reply at roughly the same rate as before, but with materially worse content.
Manager-driven recognition fell faster than peer recognition. Recognition per manager (annualized) fell from 12.85 to 6.42 per year, a 50% decline, with 82% of companies declining. Peer recognition events per user fell 61%; manager recognition fell in the same range, and fewer managers are participating at all.
Most customers track reply rate. The sharper manager signal is reply quality. When mean_reply_quality drops, pull qualitative reply samples for the affected managers. Coaching plays on recognition should target managers specifically, since the manager-driven slice of recognition is shrinking faster than the peer slice.
Finding 4 — Exits rose and pre-exit warning signs weakened
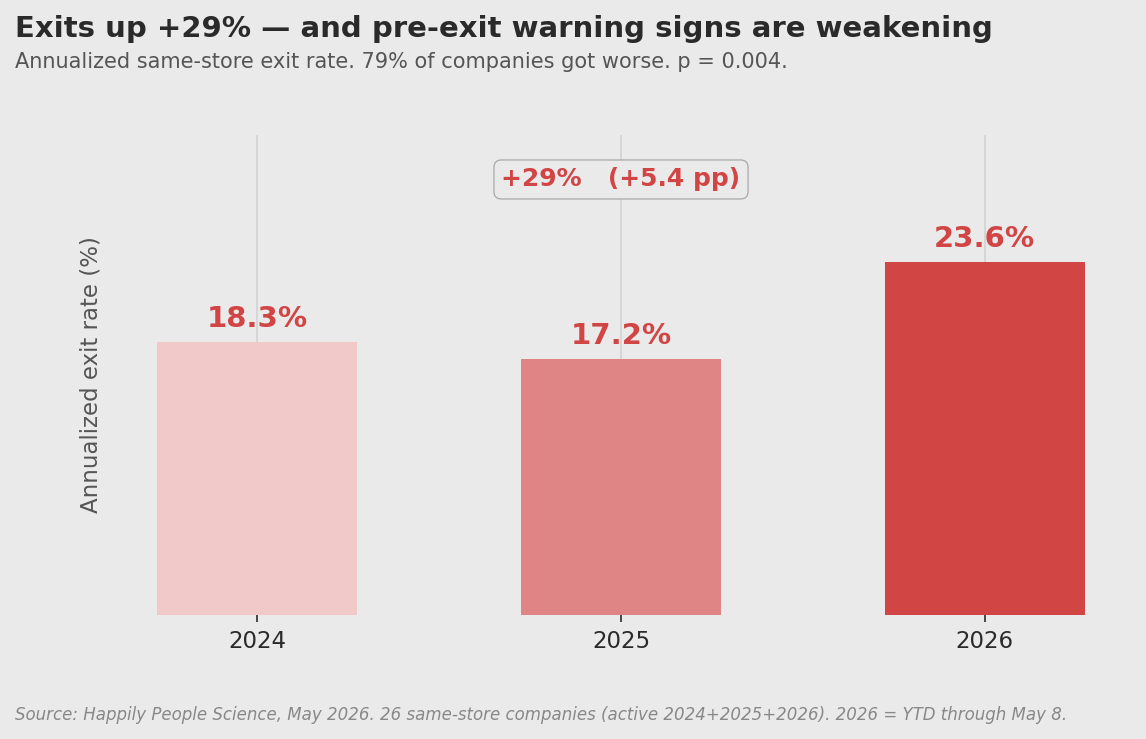
The same-store annualized exit rate rose from 18.4% in 2024 to 23.9% in 2026, a +29.3% relative increase or +5.5 percentage points (Cohen's d = 0.58, p = 0.004). 79% of same-store companies saw exits rise. The Wilcoxon p of 0.004 makes this one of the most statistically robust findings in the study.
The trajectory matters: 2024 to 2025 was almost flat (18.4% → 17.4%), then 2025 to 2026 jumped to 23.9%. The deterioration is concentrated in 2026. The 2026 figure is annualized from 128 days, so if exits cluster in Q1 it may run a few points high, but a real rise of meaningful magnitude is indicated.
Pre-exit warning signs are also weakening. The pre-exit negative-mood rate — the share of departing employees showing negative mood in their final 90 days — fell from 3.3% in 2024 exits to 1.6% in 2026 exits, a 52% drop. The Wilcoxon test is inconclusive here (p = 0.28), so this is a directional signal. But combined with the rising exit rate, it points to a worrying shift: more people are leaving, and they show less observable distress before they go.
This is the "engaged exit" pattern — calm, productive employees leaving anyway — expanding from an edge case toward the dominant exit profile. Quiet employees should not be assumed to be content employees.
What this means
Two interpretations are consistent with the data. The first is a labor-market effect: a softer 2026 job market lets employees recover energy while also making them more willing to test the market, so WHO-5 captures recovery and the exit rate captures opportunism. The second is within-job disengagement: employees feel fine about themselves, but the relational texture of work has thinned — less recognition, weaker manager replies, less peer feedback — so they feel okay but are not invested, and they leave when something better appears.
The labor-market hypothesis would predict eNPS holding steady or rising slightly. Instead eNPS fell alongside every other relational metric. The within-job disengagement reading is consistent with every dimension in this study, and it is the one we lean toward.
| Decision | What the data implies |
|---|---|
| Reading a customer health story | Do not treat a rising WHO-5 score as proof engagement is healthy. Track active-day rate and silent share alongside it. |
| Prioritizing interventions | Lead with active participation — recognition, qualitative feedback, reply rate — rather than pulse volume, which mostly reflects issuance. |
| Fixing the feedback channel | With 96% of text prompts unanswered, cut text prompts to the highest-value ones or visibly act on responses so writing in feels worthwhile. |
| At-risk modeling | Weight recognition and reply-quality declines higher than mood signals. They have stronger same-store deltas and they precede the exit shift. |
The single number to put in front of a CHRO is the silent share. In 2024, 6% of employees in a same-store company answered nothing all year. In 2026, that figure is 27%. One in four employees is now completely outside the feedback loop. Well-being is up, and that is genuine, but it is not insurance against this. The job is to rebuild active participation before the well-being metric starts following the rest down.
Limitations
- 2026 is year-to-date. 128 days, roughly 35% of a year. Annualization assumes even monthly distribution; seasonal clustering would misstate annualized volume metrics and could bias the active-day rate and exit rate by a few points.
- Small paired samples on some metrics. WHO-5 has only 13 of 26 same-store companies with full coverage. Boosts per manager had only 5 valid companies and is excluded from headlines. eNPS and reply rate are borderline on the paired test (p = 0.13 and p = 0.65).
- Reply latency is unmeasured. The reply-pairing logic uses calendar dates, so latency rounds to 0 days for most companies. Future studies should use timestamp resolution.
- Same-store is 14% of the customer base. The cohort isolates within-customer change cleanly, but it is a minority of the 187 companies seen. All-customers figures are reported alongside and align in direction.
- The counting correction is recent. The corrected answered-rows method is more honest than the earlier draft, but it depends on the assumption that a non-null answer reliably marks a real response.
Happily Research (2026). The Well-Being Paradox: Calmer Employees, Collapsing Engagement. happily.ai/research/yoy-trends-2026/
References
- Topp, C. W., et al. (2015). The WHO-5 Well-Being Index: A Systematic Review of the Literature. Psychotherapy and Psychosomatics, 84(3), 167–176. Source of the five-dimension well-being instrument used here.
- Reichheld, F. (2003). The One Number You Need to Grow. Harvard Business Review, December 2003. Origin of the Net Promoter framework adapted for eNPS.
- Happily Research (2026). YoY Trends 2024–2026. Internal analysis, 26 same-store companies and 187 companies seen, study window January 1, 2024 to May 8, 2026. Generated May 8, 2026.
Happily tracks well-being, recognition, feedback, and retention together — so a rising well-being score never masks a quiet exit from engagement underneath it.
Get in touch