

The Activation Gap is the measurable difference between culture tools that achieve widespread daily use and the 75% that become organizational shelfware. This concept is best for CEOs evaluating HR technology investments and CHROs questioning ROI on existing engagement tools.
Best for: Organizations spending on engagement platforms but seeing flat results. CEOs who suspect their culture tools are not delivering. CHROs preparing a business case for consolidating or replacing HR tech.
Three out of four employees will never log into the culture tool your organization purchased for them.
That is the finding across multiple industry analyses. HR technology adoption averages 25% across the sector (Josh Bersin, 2023). The remaining 75% of licensed users either never onboard, abandon the tool after initial setup, or participate only when mandated during review cycles.
This creates a problem that goes beyond wasted software spend. It produces something worse: biased data from a self-selecting quarter of your workforce, presented as if it represents the whole organization. Decisions made on that data are not uninformed. They are misinformed.
The HR technology adoption crisis has a name. We call it the Activation Gap: the distance between tools that measure culture and tools that activate it. This gap explains why a decade of engagement tool adoption rate growth has not moved the global engagement needle. Closing it requires rethinking what culture tools are designed to do.
The HR Technology Adoption Crisis in Numbers
The scale of the problem is difficult to overstate.
Organizations spent an estimated $16.1 billion on HR technology in 2023 (Grand View Research, 2023). Engagement platforms, pulse survey tools, recognition software, feedback systems. The category has exploded. Yet Gallup's global engagement data shows worldwide engagement sitting at 23%, a number that has barely moved in over a decade (Gallup, 2024).
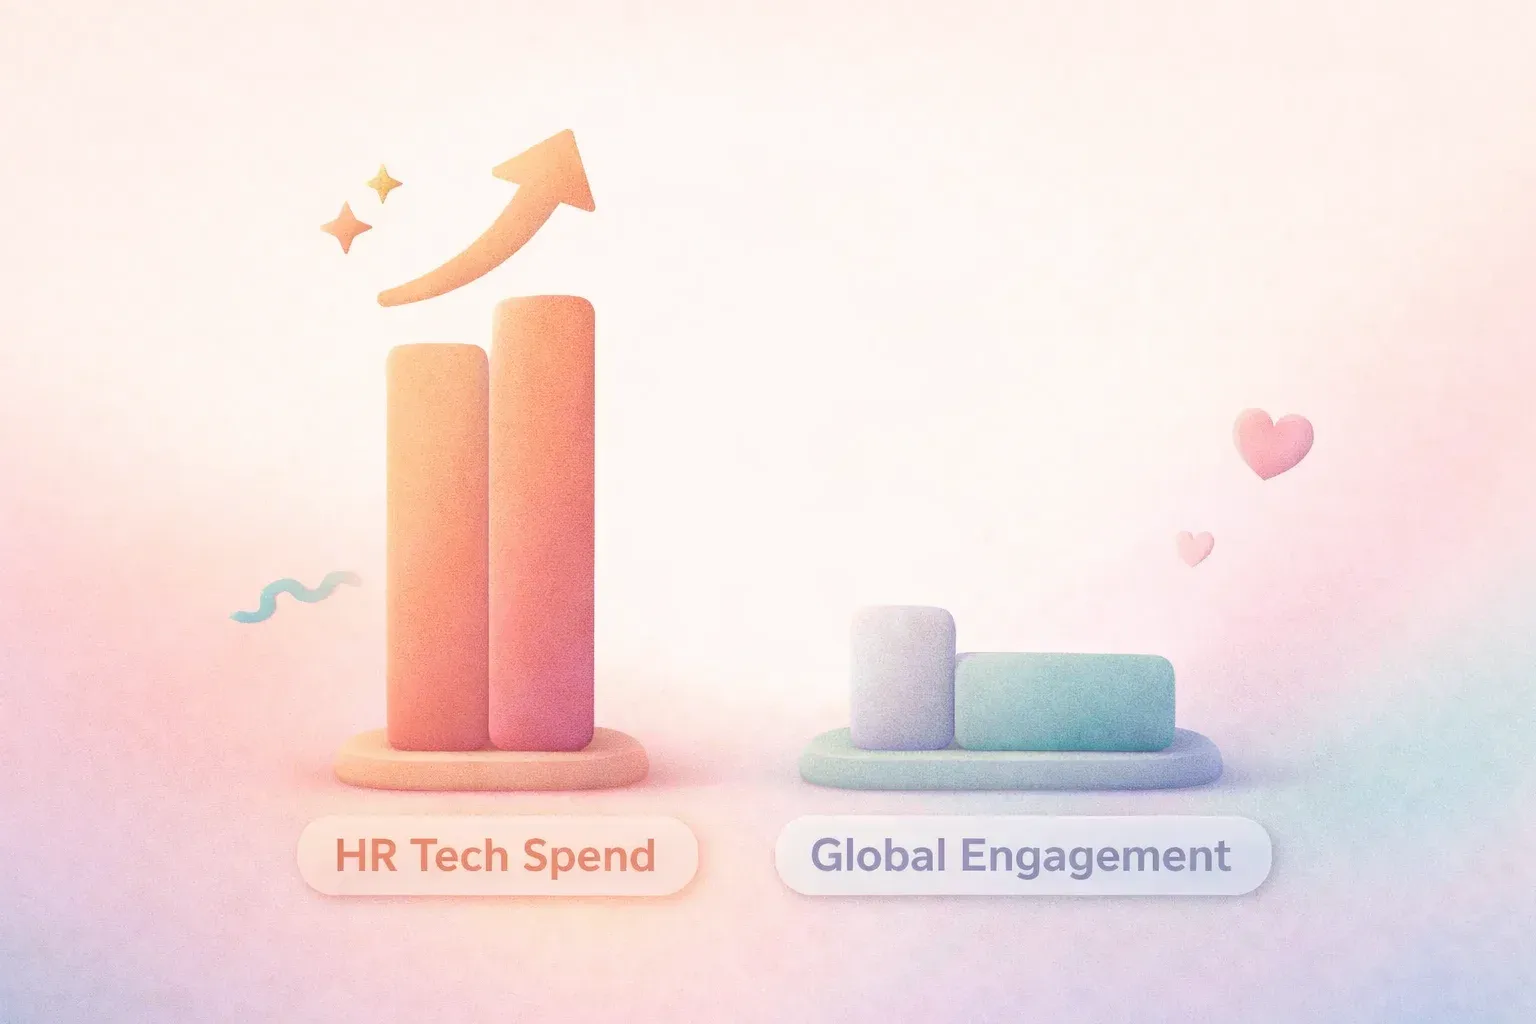
How is that possible? Billions invested, global engagement frozen.
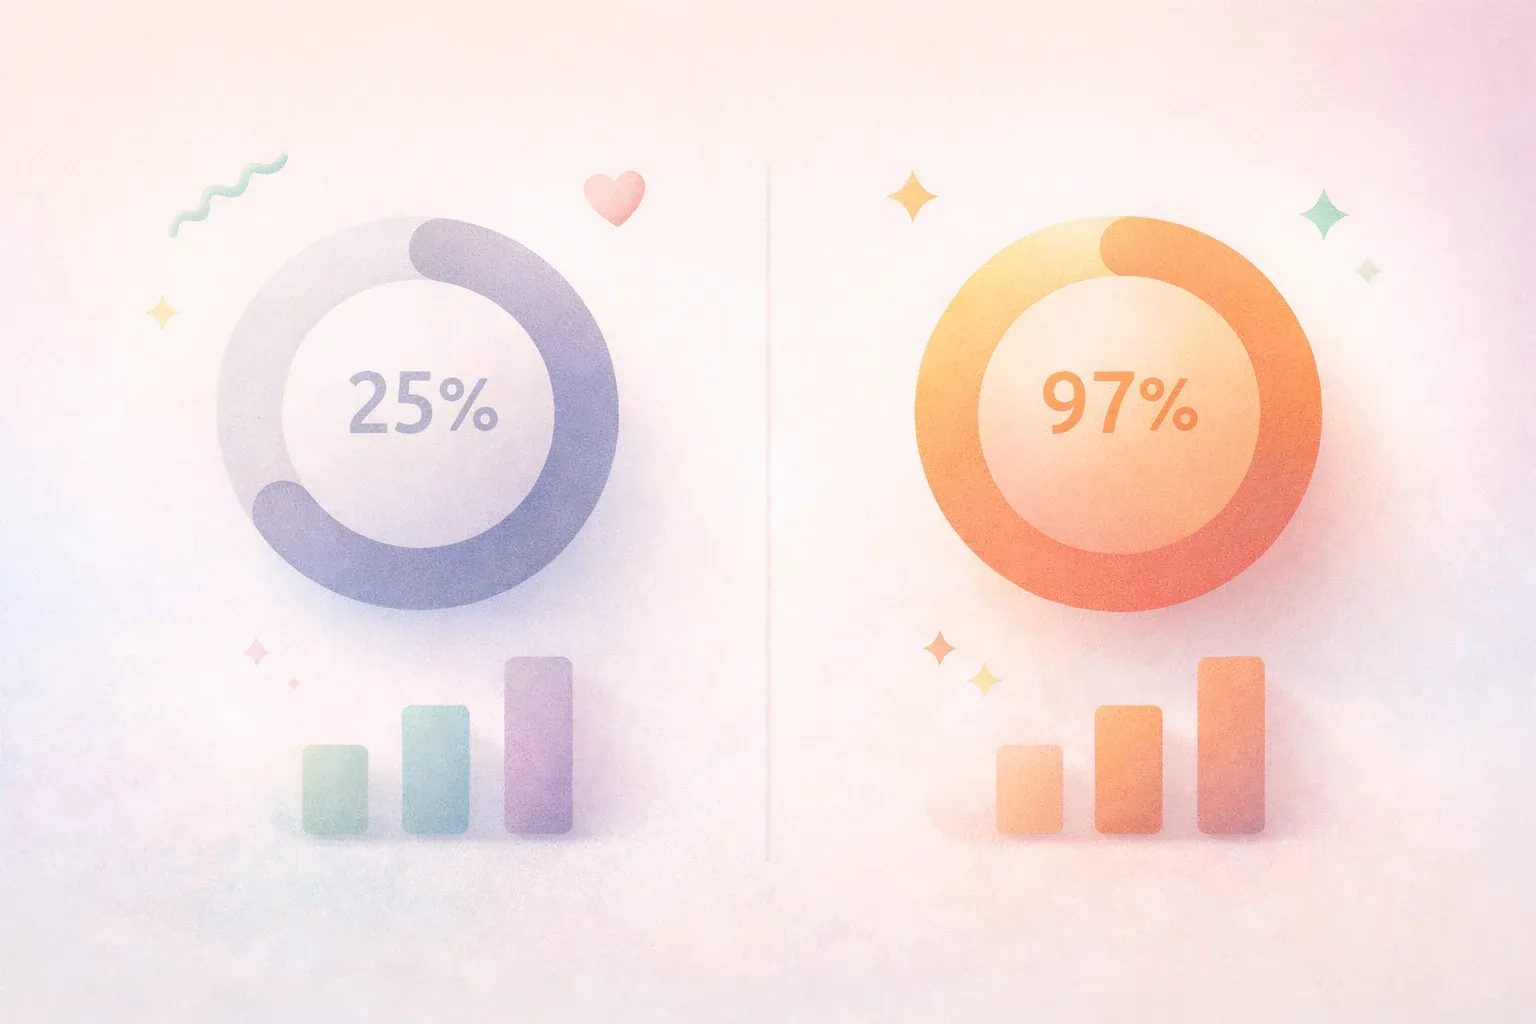
The answer sits in the adoption data. When only 25% of employees use a tool, you aren't measuring culture. You're measuring the opinions of the quarter most likely to participate: typically the most engaged, most senior, or most compliant employees in the organization.
Research from McKinsey's 2023 State of Organizations report found that 72% of organizational transformations fail, with "employee fatigue and resistance" cited as the primary driver. Survey tools designed to diagnose this resistance are themselves subject to it. The diagnostic instrument has the same disease it is trying to measure.
This produces three compounding failures:
- Biased signal. The 25% who participate skew toward the already-engaged. Problems in the disengaged 75% go undetected until they surface as attrition.
- False confidence. Leadership teams see survey scores from an engaged subset and conclude that culture is healthy. The disengaged majority stays invisible.
- Intervention misfire. Programs designed around biased data address the wrong problems. Resources flow to issues raised by the participating minority, missing the root causes driving disengagement in the silent majority.
What the Activation Gap Costs
The financial impact of the Activation Gap operates on three levels.
Direct Waste
At the surface, there's the cost of unused software. License fees for employees who never log in. Implementation costs for tools that collect dust. Training hours for systems nobody uses after the first quarter.
But the direct waste is the smallest cost.
Decision Distortion
The larger cost comes from decisions made on distorted data. When your engagement data represents 25% of the workforce, every action taken based on that data carries a confidence interval so wide it is effectively meaningless.
Consider a practical example. A 200-person organization runs an engagement survey with 25% participation. That's 50 responses. A CEO making strategy decisions about culture, manager development, and retention based on 50 self-selected data points from 200 employees is not data-driven. That is data-deceived.

Research from Happily.ai's dataset of 10 million+ workplace interactions across 350+ organizations over 9 years reveals what happens when this participation gap closes. Organizations achieving 97% adoption see savings of approximately $480,000 per year per 100 employees through reduced turnover, lower absenteeism, and improved productivity (Happily.ai, 2025).
The $480K represents the value of closing the Activation Gap: the difference between data from 25 people and data from 97.
Strategic Blind Spots
The third cost is the hardest to quantify but potentially the most damaging. Organizations with low-adoption tools develop blind spots about alignment.
Analysis of Glassdoor employee reviews found a 149% year-over-year increase in misalignment mentions (Happily.ai workplace analysis, 2025). Teams are drifting further from organizational goals, and the tools designed to catch this drift are not reaching the employees experiencing it most.
When alignment erodes silently, the symptoms look like individual performance issues: missed deadlines, low output, interpersonal conflict. The systemic cause stays hidden until it manifests as a wave of departures.
Why Engagement Tool Adoption Fails
The standard explanation for low HR technology adoption is "change management." If only we communicated better, trained more thoroughly, or got more executive sponsorship, employees would use the tools.
This explanation is convenient but incomplete. It shifts blame to execution while ignoring a design problem. Four structural features of traditional culture tools work against sustained adoption.
Compliance Framing
Most culture tools are deployed with a compliance frame. "Please complete your quarterly engagement survey." The language and cadence signal obligation, not opportunity.
Research on self-determination theory (Deci & Ryan, 2000) establishes that compliance-driven participation undermines intrinsic motivation. When people feel controlled, their engagement with the activity itself decreases, even if they comply in the short term. The tool may capture a response, but it captures a diminished one.
Quarterly Cadence
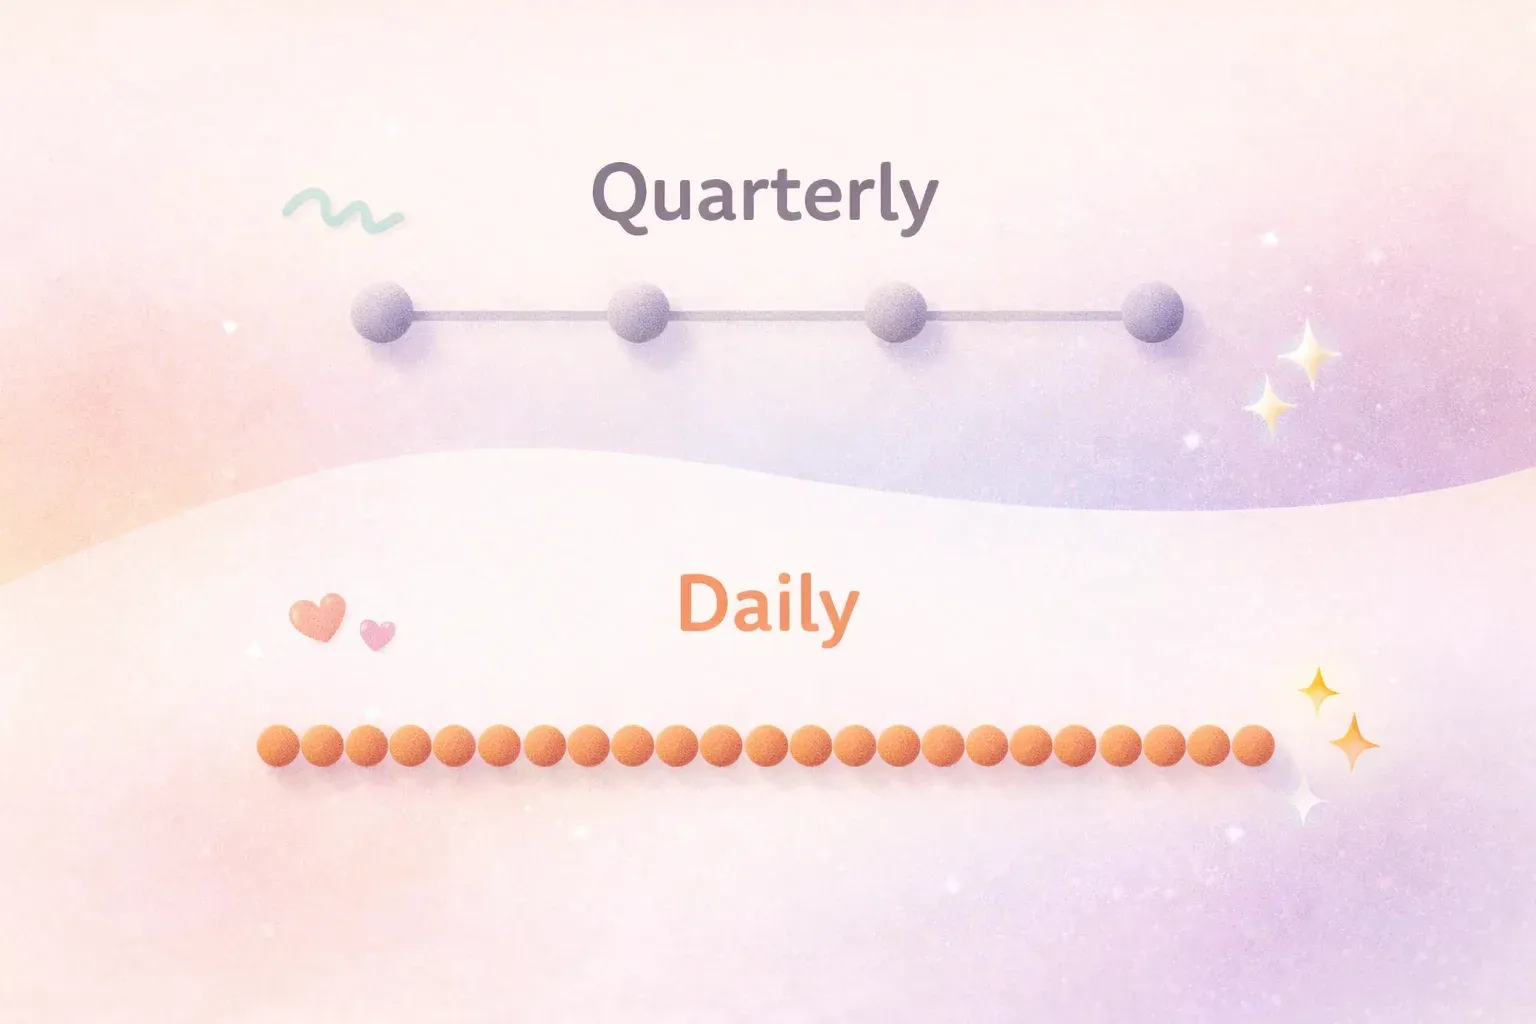
Behavioral science is clear on habit formation: frequency matters more than intensity. A behavior performed daily becomes automatic within 66 days on average (Lally et al., 2010). A behavior performed quarterly never becomes a habit. It remains a task on a to-do list.
Quarterly surveys ask employees to shift into reflection mode four times a year. Between surveys, the tool is invisible. No habit forms. No behavioral loop closes. Each survey cycle requires the same activation energy as the first.
Manager Burden
Low-participation tools create a downstream burden on managers. When survey response rates drop, managers become compliance enforcers: sending reminders, following up in 1:1s, trying to coax participation from reluctant team members.
This reframes the manager's relationship with the tool from "useful diagnostic" to "administrative overhead." Over time, even managers who initially valued the data begin to associate the tool with nagging.
No Intrinsic Return
The most fundamental design failure: employees see no personal benefit from participation. They provide data. That data flows upward. Insights (if any) return months later in the form of organizational initiatives that may or may not address their specific concerns.
The feedback loop is broken. Contribution produces no visible return. In behavioral design terms, the tool violates the core principle of operant conditioning: behaviors that go unreinforced eventually extinguish.
What 97% HR Technology Adoption Looks Like
Closing the Activation Gap requires more than better change management. It requires a different design philosophy: building tools that employees want to use daily, not tools employees are told to use quarterly.
Happily.ai's data provides a benchmark for what becomes possible when adoption reaches 97% across an organization. These outcomes emerge from continuous behavioral data, not periodic snapshots.
eNPS Improvement
Organizations on the Happily.ai platform see an average +48 point improvement in eNPS (Happily.ai, 2025). Industry benchmarks for engagement tool implementations typically show +5 to +10 point improvements (SHRM, 2023).
The mechanism matters: a +48 point shift doesn't come from measuring more. It comes from activating daily behaviors (recognition, feedback, alignment check-ins) that directly drive the sentiment eNPS measures. The tool changes the score because it changes the behavior, not because it measures the behavior more accurately.
Turnover Reduction
Organizations using high-adoption culture activation tools see 40% turnover reduction compared to their pre-implementation baselines (Happily.ai, 2025). Industry averages for engagement platform implementations hover around 10-15% reduction (Gallup, 2023).
The difference maps directly to data coverage. When 97% of employees generate behavioral signals daily, at-risk employees become visible through pattern changes long before they update their LinkedIn profile. When only 25% participate, the disengaged employees most likely to leave are the same employees most likely to skip the survey.
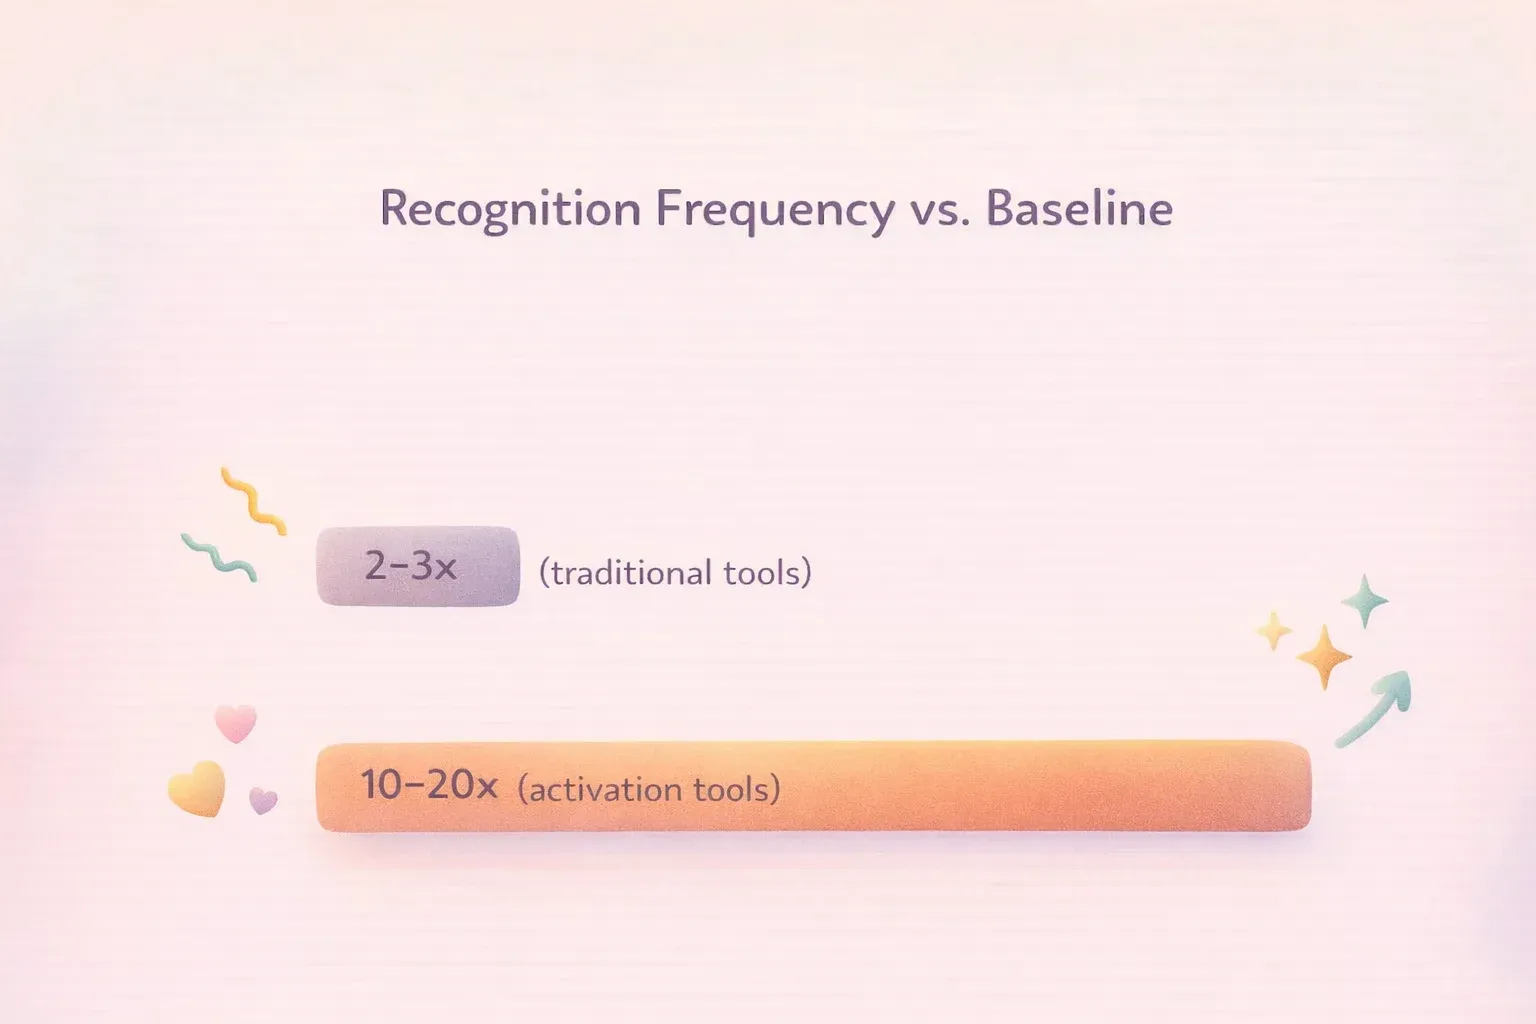
Recognition Frequency
Perhaps the clearest indicator of the Activation Gap closing: recognition frequency increases 10-20x over baseline when tools are designed for daily use (Happily.ai, 2025). Traditional recognition programs, even well-implemented ones, typically achieve 2-3x improvements (Bersin, 2022).
This matters because of what Happily.ai's research calls the 9x trust multiplier. Employees who give recognition are trusted 9x more by colleagues who witness it. When mutual recognition occurs (both giving and receiving), trust ratings reach 52%, or 20.8x the baseline.
Depth matters too. Employees who recognize the same colleagues consistently achieve 69% trust rates, compared to 40% for those who spread recognition thinly.
At 25% adoption, these trust dynamics never emerge at scale. At 97%, they become the operating system of the organization.
The Behavioral Science Mechanism Behind Culture Activation
Why does the same workforce that ignores a quarterly survey engage daily with a culture activation tool? The answer lies in four behavioral design principles that separate activation from measurement.
Gamification as Habit Architecture
Gamification has earned a mixed reputation in HR. Most implementations amount to what researchers call "pointsification": bolting game mechanics (badges, leaderboards, points) onto fundamentally unrewarding activities. This is gamification theater, and it fails for the same reason a participation trophy fails to motivate an athlete.
Effective gamification works differently. It applies the structural principles of game design to habit formation. The Fogg Behavior Model (B = MAP) defines behavior as a function of Motivation, Ability, and a Prompt occurring simultaneously.
Culture activation tools that achieve 97% adoption get all three right:
- Motivation: Participation itself is rewarding. Recognizing a colleague, responding to a prompt about your workday, seeing how your team is doing. These activities provide intrinsic satisfaction, not compliance pressure.
- Ability: The interaction takes under 60 seconds. No training needed. No complex interface. The barrier to participation approaches zero.
- Prompt: Daily notifications arrive at consistent times, integrated into existing workflows. The prompt is the behavioral trigger that makes the habit automatic.
Intrinsic Over Extrinsic Motivation
Self-determination theory identifies three psychological needs that drive intrinsic motivation: autonomy, competence, and relatedness. Culture activation tools satisfy all three.
Autonomy: Employees choose when, how, and whether to recognize, respond, or reflect. Participation is voluntary, which paradoxically increases participation rates compared to mandated surveys.
Competence: The tool provides feedback loops. Employees see the impact of their recognition, track their own engagement patterns, and observe team dynamics evolving. The experience of growing capability sustains engagement.
Relatedness: Daily micro-interactions build social bonds. Peer recognition, team celebrations, shared reflections. These create a sense of belonging that a quarterly survey never can.
Daily Micro-Interactions Replace Quarterly Surveys
The shift from quarterly to daily changes everything about data quality. A quarterly survey captures a snapshot influenced by recency bias, current mood, and whatever happened that week. Daily micro-interactions produce a behavioral dataset that reveals trends, patterns, and leading indicators.
This is the difference between a photograph and a video. A photograph can be misleading. A video reveals trajectory.
For CEOs evaluating people analytics, this distinction is critical. Decisions based on quarterly snapshots are decisions based on artifacts. Decisions based on daily behavioral data reflect what's actually happening in the organization.
Behavioral Nudges as Default Architecture
The final mechanism: culture activation tools use choice architecture to make participation the default rather than the exception.
Research on default effects shows that people overwhelmingly stick with the default option. Organ donation rates, retirement savings contributions, and software settings all demonstrate this pattern. When participation is the default (daily prompt, one-tap response, integrated into workflow), opt-out rates are minimal.
Traditional tools require opt-in: remember to log in, navigate to the survey, allocate time, complete the assessment. Each step is a friction point. Research on behavioral friction consistently shows that each additional step in a process significantly reduces completion rates. A five-step survey process loses the majority of potential participants before a single question is answered.
Culture Tool ROI: When to Choose Activation Over Measurement
The Activation Gap doesn't mean measurement tools have no value. It means their value depends on your starting conditions and goals.
If/Then Decision Framework
| Your Situation | Choose Culture Activation If... | Choose Measurement Only If... |
|---|---|---|
| Current adoption rate | Below 50% on existing tools | Already above 80% on current platform |
| Primary goal | Change daily behaviors and build habits | Benchmark current state against industry |
| Data needs | Continuous leading indicators for proactive decisions | Annual or quarterly snapshots for board reporting |
| Manager capacity | Managers are overwhelmed by administrative HR tasks | Managers have bandwidth for survey follow-up cycles |
| Workforce profile | Frontline, distributed, or deskless employees | Primarily knowledge workers at desks all day |
| Culture maturity | Building or rebuilding culture from the ground up | Established culture needing periodic health checks |
| Budget justification | Need to demonstrate ROI within 6 months | Can wait 12-18 months for longitudinal data |
Outcomes at 25% vs. 97% Adoption
The following comparison draws on published industry benchmarks and Happily.ai's platform data from 350+ organizations.
| Metric | 25% Adoption (Industry Avg) | 97% Adoption (Culture Activation) | Source |
|---|---|---|---|
| eNPS improvement | +5 to +10 points | +48 points | SHRM, 2023 / Happily.ai, 2025 |
| Turnover reduction | 10-15% | 40% | Gallup, 2023 / Happily.ai, 2025 |
| Recognition frequency vs. baseline | 2-3x | 10-20x | Bersin, 2022 / Happily.ai, 2025 |
| Data coverage of workforce | 25% (biased sample) | 97% (representative) | Industry average / Happily.ai |
| Time to insight | Quarterly (60-90 day lag) | Daily (real-time behavioral data) | Industry standard / Happily.ai |
| Manager burden | High (compliance enforcement) | Low (self-sustaining engagement) | Practitioner reports |
| Annual savings per 100 employees | Difficult to attribute | ~$480,000 | Happily.ai, 2025 |
| Trust-building behaviors | Minimal at scale | 9x trust multiplier active across workforce | Happily.ai, 2025 |
Honest Limitations
Culture activation tools are not universally superior. They have tradeoffs worth acknowledging.
They require organizational commitment. A measurement tool can be deployed to a subset of the organization as a pilot. Activation tools produce their strongest results at full-organization scale, which means a larger upfront commitment.
They generate more data, which requires more interpretation. Daily behavioral data can overwhelm leaders accustomed to quarterly summaries. Organizations need analytical capacity (or AI-powered synthesis) to extract actionable insights from continuous data streams.
They may face initial skepticism. Employees accustomed to annual surveys may question why a tool wants daily interaction. The gamification frame, if poorly communicated, can feel trivializing. Clear communication about purpose matters.
Measurement still matters. Activation without measurement is action without direction. The strongest approach combines daily activation (changing behaviors) with periodic assessment (evaluating whether those behavior changes produce desired outcomes). The tools aren't mutually exclusive. The question is which leads.
Closing the Activation Gap: What to Do Next
The Activation Gap persists because organizations keep buying measurement tools and hoping for activation outcomes. The tool category itself is misaligned with the goal.
Three steps to close the gap:
1. Audit your current adoption honestly. Pull login data, not survey completion rates. How many employees interact with your culture tools weekly? If the answer is below 50%, your data is not representative enough to drive strategy. The existing tool may still have value for benchmarking, but it cannot serve as your primary culture intelligence system.
2. Evaluate tools on behavioral design, not feature lists. When assessing HR technology, ask four questions. What is the daily experience for an individual contributor? How many seconds does participation take? What intrinsic reward does the employee receive? Does the tool build habits or extract data? These answers predict adoption more reliably than any demo or feature comparison.
3. Measure what changes, not what scores. The goal of a culture tool is not to produce a score. It is to produce behavior change at scale: more recognition, faster feedback, better alignment, earlier problem detection. Use the Happily.ai ROI calculator to model the financial impact of closing the Activation Gap in your specific organization.
The $16.1 billion HR technology market has produced a generation of tools that are excellent at measurement and poor at activation. The Activation Gap closes when organizations shift the question from "How do we measure culture?" to "How do we activate it?"
That shift leads to a different category of tool. One designed for daily engagement, not quarterly assessment. One where 97 out of 100 employees participate because the experience itself is worth their time.
Start by understanding what culture activation means and how the science of team performance supports the shift from measurement to action. The data shows what becomes possible on the other side of the gap. The only question is whether your organization is ready to cross it.
FAQ
What is the Activation Gap in HR technology? The Activation Gap is the difference between culture tools that achieve widespread daily use (97% adoption) and the industry average where 75% of licensed users never engage meaningfully with the platform. It explains why billions spent on engagement technology have not improved global engagement scores. The gap exists because most tools are designed to measure culture, not activate the daily behaviors that create it.
Why do most employee engagement tools have low adoption rates? Four structural factors drive low HR technology adoption: compliance-based framing that undermines intrinsic motivation, quarterly cadence that prevents habit formation, manager burden from chasing participation, and broken feedback loops where employees provide data but receive no visible return. Each factor is rooted in behavioral science. Tools designed against these principles produce adoption rates of 25% or lower.
How much does low engagement tool adoption cost an organization? The direct cost (unused licenses) is the smallest component. The larger costs include decision distortion from biased data, missed early warning signals for attrition, and misallocated resources addressing the wrong cultural problems. Organizations that close the Activation Gap and reach 97% adoption see approximately $480,000 in annual savings per 100 employees through reduced turnover, lower absenteeism, and improved productivity.
Is Happily.ai worth it for companies with 100-500 employees? Organizations in the 100-500 employee range sit in the zone where the Activation Gap is most costly. They're large enough that culture can't be managed through personal relationships alone, but small enough that every departure creates outsized disruption. Happily.ai's 97% adoption rate means these organizations get representative data from nearly every employee, enabling proactive interventions. The $480K annual savings per 100 employees provides a framework for calculating expected ROI at your specific scale.
What's the difference between culture measurement and culture activation? Culture measurement tools capture periodic snapshots of sentiment through surveys, typically achieving 25% adoption and producing data with significant participation bias. Culture activation tools drive daily behavioral change (recognition, feedback, alignment check-ins) through gamification and behavioral nudges, achieving up to 97% adoption. The key distinction: measurement tells you what your culture looks like today. Activation changes what your culture looks like tomorrow. Both have value. The question is which should lead your strategy.
Sources:
- State of HR Technology 2023 - Josh Bersin (2023)
- State of the Global Workplace 2024 - Gallup (2024)
- HR Technology Market Size Report - Grand View Research (2023)
- State of Organizations 2023 - McKinsey & Company (2023)
- Self-Determination Theory and the Facilitation of Intrinsic Motivation - Deci & Ryan (2000)
- How Are Habits Formed - Lally, van Jaarsveld, Potts & Wardle (2010)
- Glassdoor Employee Review Analysis (misalignment trends) - Happily.ai workplace analysis (2025)
- Happily.ai Platform Data - 10M+ interactions, 350+ organizations, 9 years (2025)