

On this page
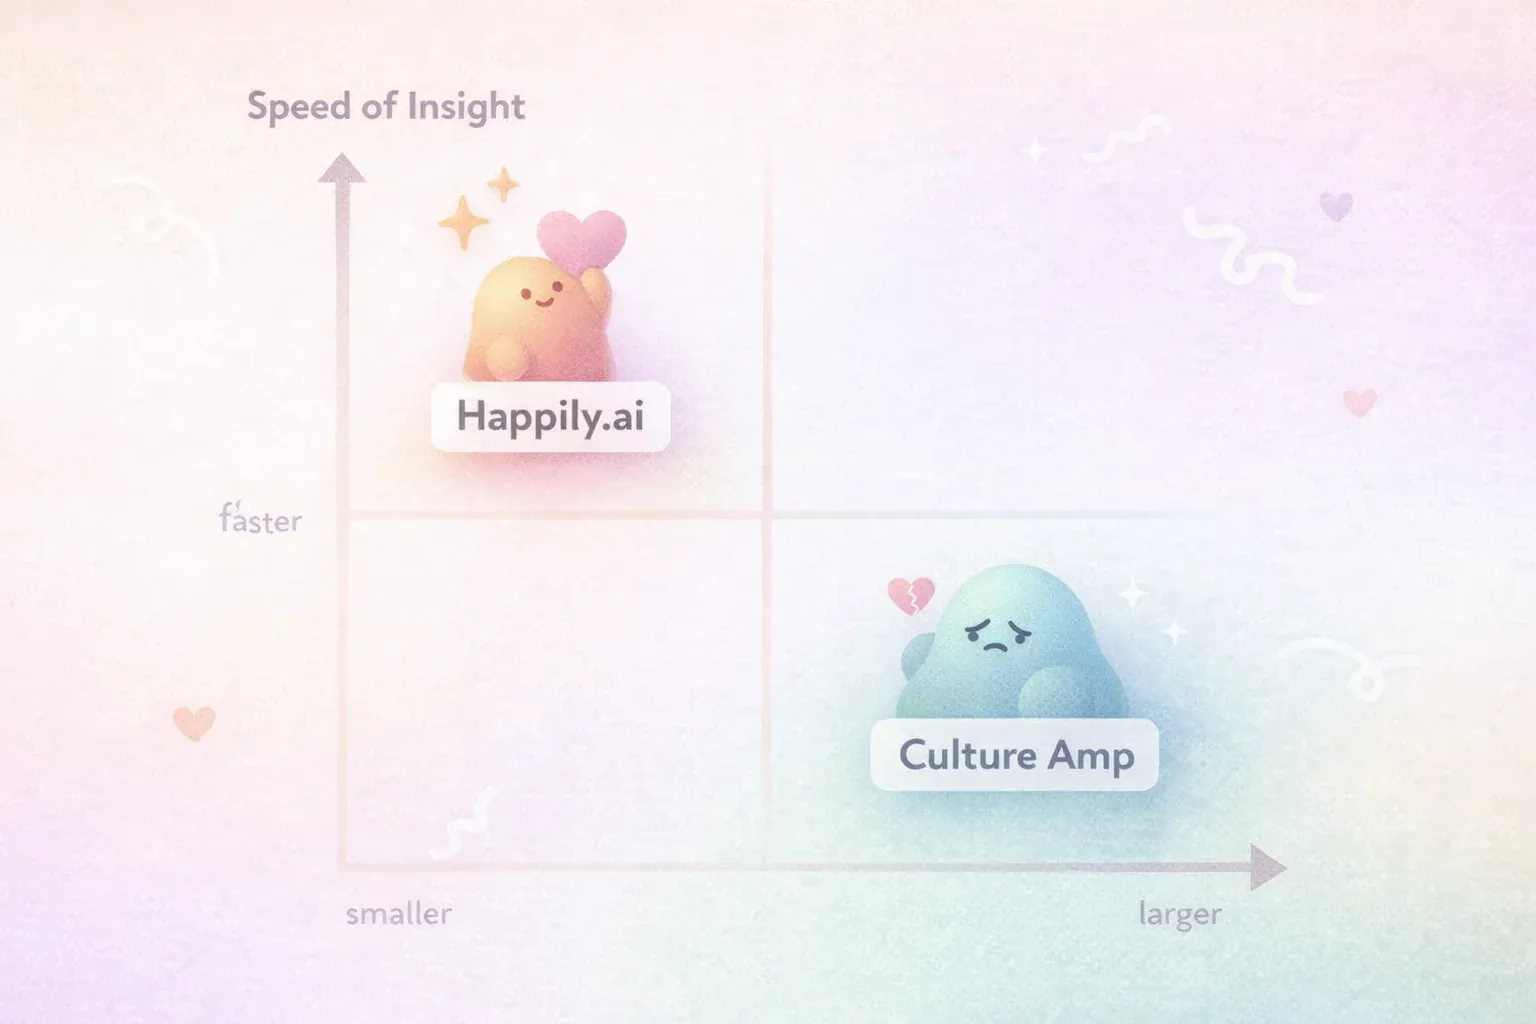
Happily.ai is a team effectiveness platform that gives CEOs and managers continuous visibility into team health, focus, and goal progress through daily habits rather than periodic surveys. It was designed for growth-stage companies (50-500 employees) where adoption and speed matter more than enterprise benchmarking.
Culture Amp is an enterprise employee experience platform built around periodic surveys, benchmarking data, and analytics for large-scale organizations. It serves established companies that need standardized measurement across thousands of employees and deep comparisons against industry peers.
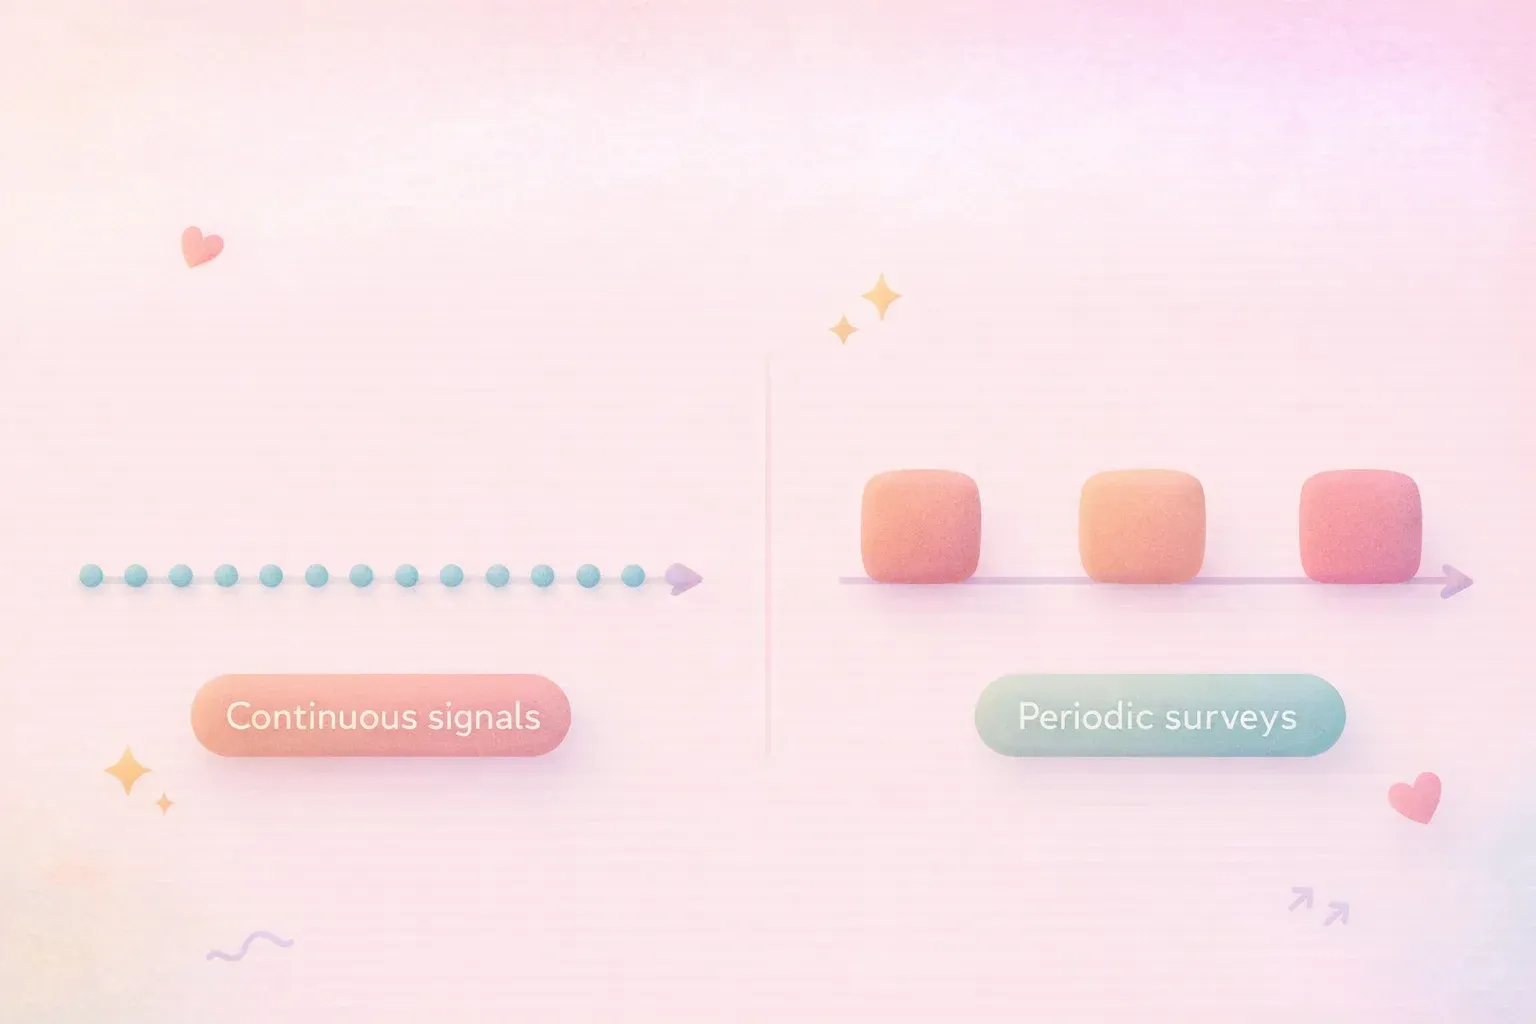
Both platforms help organizations understand and improve their people dynamics. But they take fundamentally different approaches. Culture Amp structures measurement around periodic surveys and benchmarks. Happily.ai structures daily habits that generate continuous signals. Which approach fits depends on your company stage, your biggest challenge, and how you think about data.
This guide breaks down where each platform excels, where each falls short, and how to decide which one fits your organization.
Quick Comparison: Happily.ai vs Culture Amp
Before diving into the details, here's an at-a-glance view of how the two platforms differ across the dimensions that matter most to a growing company.
| Feature | Happily.ai | Culture Amp |
|---|---|---|
| Best For | Growth-stage companies (50-500) needing daily signals | Enterprise organizations (500+) needing survey benchmarks |
| Core Approach | Daily habits + behavioral science | Periodic surveys + analytics |
| Adoption Rate | 97% voluntary daily use | Varies by survey cycle (typically 60-80% response rate) |
| Primary Buyer | CEOs, founders scaling teams | HR leaders at enterprise scale |
| Time to Value | Weeks | Months |
| Data Freshness | Continuous (daily signals) | Periodic (quarterly/biannual surveys) |
| Manager Focus | Real-time effectiveness signals + AI coaching | Post-survey action planning |
| Pricing Model | Accessible for growth-stage | Enterprise pricing tier |
Where Culture Amp Excels
Culture Amp has earned its reputation. For the right organization, it delivers genuine value. Here's where it stands out.
Industry Benchmarking at Scale
Culture Amp's biggest strength is its benchmark database. With data from over 6,000 companies, it can tell you exactly how your engagement scores compare to similar organizations in your industry, geography, and size band. If your board asks "how do we compare to other Series C companies in tech?", Culture Amp gives you that answer backed by a large dataset.
For organizations that need to report standardized metrics to investors, boards, or parent companies, this benchmarking capability is hard to match. The data is deep, well-segmented, and updated regularly.
Enterprise-Grade Analytics
Culture Amp's analytics engine was built for complexity. It handles custom segmentation across departments, locations, demographics, and tenure bands. You can drill into specific pockets of your organization and analyze trends across multiple survey cycles. For a 2,000-person company with offices in five countries, this kind of analytical depth matters.
The platform also offers text analytics for open-ended survey responses, which surfaces themes that might not appear in structured data alone.
Integration Ecosystem
Culture Amp connects to major HRIS platforms (Workday, BambooHR, Rippling), communication tools (Slack, Teams), and workflow systems. For enterprise organizations with complex tech stacks, these integrations reduce friction and help embed survey data into existing workflows.
Established Credibility
Culture Amp has been in market since 2011, has raised over $150 million in funding, and is used by recognizable brands. For HR leaders who need to justify a platform purchase to the C-suite, the brand carries weight. There's a reason it shows up on every "best employee engagement platform" list.
Research Foundation
Culture Amp employs organizational psychologists and maintains a dedicated People Science team. Their survey instruments are validated, and they regularly publish research on workplace trends. The academic rigor behind their methodology gives confidence to HR teams that care about measurement validity.
The honest assessment: For organizations above 500 employees with established HR teams and a need for periodic benchmarking against industry peers, Culture Amp provides analytical depth and credibility that larger organizations value. It's a mature platform built for mature organizations.
Where Happily.ai Excels
Happily.ai was designed to solve a different problem for a different buyer. Here's where that design pays off.
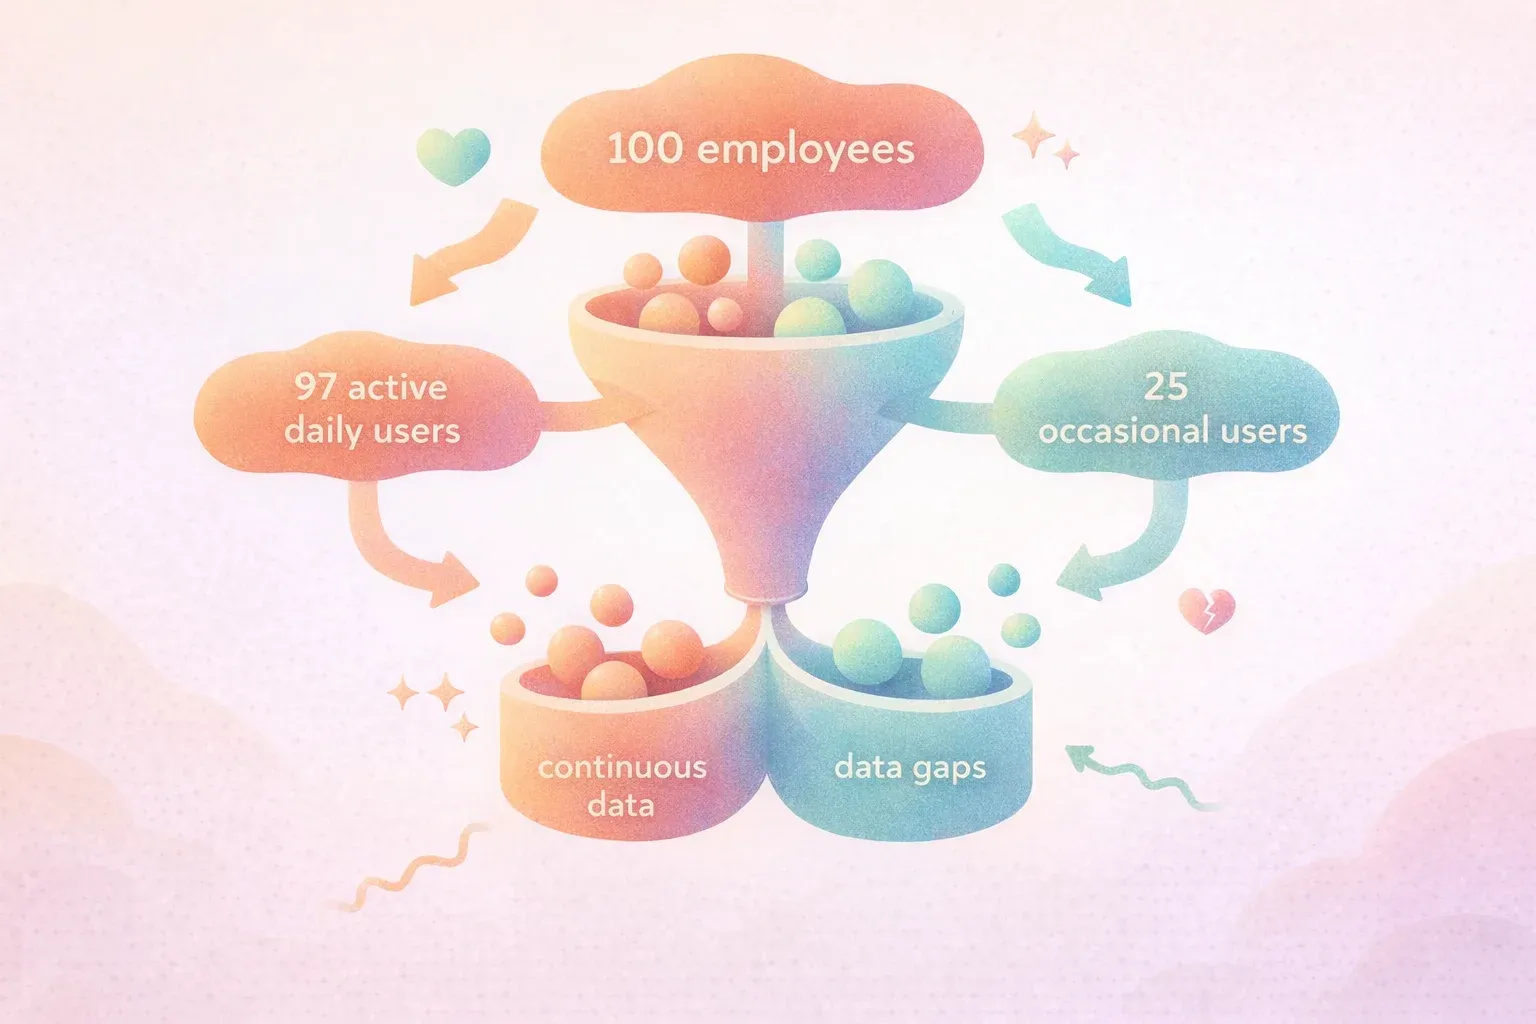
Adoption That Actually Happens (97% vs. Industry Average of 25%)
Engagement tools routinely become shelfware. Research from Gartner shows the average enterprise software tool achieves roughly 25% adoption. That's three-quarters of your investment producing zero data and zero behavior change.
Happily.ai hits 97% voluntary daily use. Not survey response rate during a biannual push. Daily, voluntary use.
This isn't a marginal difference. The gap between 25% adoption and 97% adoption is the gap between "we have an engagement tool" and "we actually know what's happening." If your team doesn't use the platform, it doesn't matter how sophisticated the analytics are. You're analyzing silence.
The reason for the gap: Happily.ai is built on the Fogg Behavior Model (B = MAP: Behavior happens when Motivation, Ability, and Prompt converge). The platform uses gamification and behavioral science to reduce friction, make daily check-ins feel rewarding rather than obligatory, and create habits that sustain without HR intervention. Think Duolingo for team performance, not a quarterly homework assignment.
Continuous Signals Instead of Periodic Snapshots
Culture Amp gives you a picture every quarter (or every six months, depending on your survey cadence). Happily.ai gives you a continuous feed.
For a CEO scaling from 80 to 200 people, waiting three months to learn that a team is struggling means waiting three months to do something about it. By the time the survey results arrive, the struggling team has already lost its best performer. The misalignment you discover in Q2 started in Q1.
Continuous data changes the dynamic entirely. You see trends as they develop, not after they've compounded. You spot a manager struggling in week two, not month six. You notice alignment drifting when it's a course correction, not a crisis.
This is the difference between a dashboard and a rearview mirror.
Real-Time Manager Effectiveness Data
Gallup's research established that managers account for 70% of the variance in team engagement. Your managers are your highest-leverage investment in culture, retention, and performance. So how quickly should you know if a manager is struggling?
Culture Amp surfaces manager-level insights after survey cycles. A manager with declining effectiveness in January may not show up in the data until the April survey results are analyzed in May. That's five months of impact before you even see it.
Happily.ai provides real-time manager effectiveness signals and AI coaching. The platform tracks feedback quality, response patterns, and team health indicators continuously. When a manager starts struggling, the signals appear in days, not quarters. And the AI coaching provides specific, personalized guidance, not generic post-survey action plans.
Built for CEO Visibility
Happily.ai was designed for CEOs who want to know three things: How are my teams feeling? What are they focusing on? Are we making progress on what matters?
Culture Amp was designed for HR teams running engagement programs. It's excellent at that job. But for a CEO of a 150-person company who wants to pull up a dashboard and understand team health in real time, the experience is different. Happily.ai puts that visibility front and center because CEOs are the primary user, not a secondary audience.
Growth-Stage Fit
Happily.ai was built for the 50-500 employee sweet spot. That means quick implementation (weeks, not months), accessible pricing for growth-stage budgets, and design decisions that prioritize speed and simplicity over enterprise complexity.
Culture Amp's enterprise pricing and implementation timeline make more sense when the per-employee cost is distributed across thousands of seats and the HR team has bandwidth for a multi-month rollout. For a 120-person company that needs answers in Q1, not Q3, that timeline doesn't fit.
Alignment and Focus Visibility
Happily.ai shows what teams are actually working on, mapped against company goals. This gives CEOs something survey-based tools fundamentally cannot provide: a view of whether daily work connects to strategic priorities.
When misalignment complaints spike 149% year-over-year across industries, this visibility matters. Surveys can ask employees if they feel aligned. Continuous signals can show you whether they actually are.
The proof points: Organizations using Happily.ai have seen a 40% reduction in turnover, $480K in annual savings, a 48-point improvement in eNPS, and a 9x trust multiplier from the platform's recognition system.
The Adoption Problem: Why This One Metric Changes Everything
Adoption deserves its own section because it's the single factor that determines whether any people platform delivers value or becomes an expensive line item.
Here's the math. If your organization has 200 employees and your engagement platform achieves 25% adoption, you're getting data from 50 people. That's not a representative sample. That's a self-selected group of either your most engaged or most frustrated employees. The 150 people who didn't participate? You know nothing about them. And they're often the ones you need to understand most.
At 97% adoption, you're hearing from 194 out of 200 people. Every day. That's not a sample. That's the population.
Why Happily.ai Gets 97%
The platform was built on three behavioral science principles that drive habitual use:
1. Reduce friction to near zero. The daily check-in takes under two minutes. There's no lengthy survey, no open-ended questions requiring deep reflection, no calendar invitation to ignore. The prompt fits into the natural rhythm of starting a workday.
2. Make it rewarding. Gamification creates intrinsic motivation. Employees earn recognition, see their impact on team dynamics, and get personalized coaching. The platform gives back more than it asks.
3. Prompt at the right moment. The Fogg Behavior Model demonstrates that prompts delivered at consistent times in existing routines (the model's "prompt" element) create habits. Happily.ai integrates into the tools people already use, so the prompt arrives where they already are.
The result: managers use it because it makes their job easier, not because HR sent a reminder email. Employees use it because it takes less time than making coffee and actually improves their workday.
The Survey Fatigue Contrast
Even well-run engagement surveys face a structural problem: response rates decline over time. The first survey might hit 85%. By the third cycle, you're fighting to stay above 65%. Employees start seeing surveys as performative, especially if they didn't see action from the last round.
And even at 80% response, that's data from one moment in time. Between surveys, you're blind. The employee who was engaged during the April survey but started job searching in May won't show up until October's survey. If they even take it.
Continuous daily signals don't have this problem. There's no "survey fatigue" because there's no survey. There's a two-minute habit that generates data as a byproduct of activities that benefit the employee directly.
For a CEO who needs to understand what breaks when their company scales, the difference between intermittent snapshots and continuous visibility is the difference between managing proactively and managing reactively.
How to Choose: A Decision Framework
The right platform depends on your situation. Here are the specific conditions that favor each option.
Choose Culture Amp If:
- Your organization has 500+ employees. Culture Amp's per-seat economics and enterprise features make more sense at scale.
- Your HR team needs enterprise-grade benchmarking. If your board or investors require standardized engagement metrics compared against industry peers, Culture Amp's 6,000-company benchmark database is built for this.
- You have the budget and timeline for a full enterprise implementation. Culture Amp's rollout typically takes months, not weeks. If you have the bandwidth and aren't in a hurry, the depth of implementation pays off.
- Your primary need is periodic measurement and trend analysis. If you want to measure the same things consistently over years and track long-term trends, Culture Amp's survey methodology is rigorous and well-validated.
- Your board requires standardized engagement metrics. Some boards and investors specifically want to see industry-standard engagement benchmarks. Culture Amp speaks that language fluently.
Choose Happily.ai If:
- Your organization has 50-500 employees and is scaling. Happily.ai was designed for this exact stage, where you're growing fast and need visibility before things break.
- You're a CEO who wants real-time visibility into team health. If you want to pull up a dashboard this afternoon and understand how your teams are doing, not wait for next quarter's survey results, Happily.ai provides that immediacy.
- Adoption is a concern. If previous tools became shelfware, or if you're skeptical that employees will actually use another platform, Happily.ai's 97% adoption rate addresses this directly.
- Manager effectiveness is your primary lever for improvement. If you believe (correctly, based on the 70% variance research) that managers are your biggest opportunity, Happily.ai's real-time manager signals and AI coaching are built for this.
- You want results in weeks, not months. Happily.ai's implementation timeline and time-to-value are designed for the pace of growth-stage companies.
- You're open to behavioral science and gamification. Happily.ai's approach is different from traditional survey platforms. If you're drawn to evidence-based behavior design rather than conventional HR tools, the product philosophy will resonate.
Frequently Asked Questions
Is Culture Amp worth it for a company with fewer than 200 employees?
It depends on what you need. Culture Amp's core strength, enterprise benchmarking, matters less when you're small enough to know most of your team personally. The implementation timeline and pricing are also optimized for larger organizations. At under 200 employees, you may be paying for capabilities you won't fully use. That said, if benchmarking against industry peers is a board requirement, Culture Amp can deliver that at any size. For most sub-200 companies, a platform designed for the growth stage, like Happily.ai, will deliver faster value.
Can Happily.ai replace Culture Amp for employee surveys?
Happily.ai takes a fundamentally different approach. Rather than periodic surveys, it generates continuous signals through daily habits. You get richer, more current data, but in a different format. If you specifically need annual engagement survey scores benchmarked against 6,000 companies, that's Culture Amp's specialty. If you need to know how your teams are doing today (not last quarter), Happily.ai gives you that. Many organizations find that continuous signals make periodic surveys unnecessary, but it's a shift in how you think about measurement.
Which platform is better for improving manager effectiveness?
Happily.ai has the advantage here. Manager effectiveness requires fast feedback loops. If a manager's team is struggling, waiting for the next survey cycle means the damage compounds for months. Happily.ai surfaces manager effectiveness signals in real time and provides AI coaching that helps managers improve continuously. Culture Amp provides manager-level insights, but only after survey data is collected and analyzed, which creates a significant delay between the problem and the insight. For a deeper look at why manager effectiveness matters, see The 70% Rule.
How do Happily.ai and Culture Amp differ in their approach to employee engagement?
Culture Amp treats engagement as something you measure periodically through surveys, then act on through post-survey action plans. The model is: measure, analyze, plan, act. Happily.ai treats engagement as a byproduct of daily habits and continuous team dynamics. The model is: build daily habits that generate signals and drive improvement simultaneously. Culture Amp emphasizes measurement. Happily.ai emphasizes behavior. Both care about outcomes, but they start from different assumptions about how to get there.
What's the typical implementation timeline for Happily.ai vs Culture Amp?
Happily.ai typically achieves full deployment within weeks, reaching that 97% adoption rate quickly because the behavioral design reduces friction for both rollout and daily use. Culture Amp's enterprise implementation typically takes several months, including survey design, integration setup, communication planning, and training. Neither timeline is "wrong." They reflect different product architectures. If you need insights this quarter, Happily.ai's speed matters. If you're planning a company-wide engagement program for next fiscal year, Culture Amp's thoroughness is appropriate.
The Bottom Line
Culture Amp and Happily.ai serve different company stages with different philosophies. Culture Amp gives large organizations periodic measurement and industry benchmarks backed by a deep database and proven survey methodology. Happily.ai gives growth-stage companies continuous signals, high adoption, and real-time manager effectiveness data built on behavioral science.
For a CEO scaling from 50 to 500 people who needs to see what's happening with their teams in real time, before problems compound, Happily.ai was built for that exact challenge. For an HR team at a 1,000+ person organization that needs enterprise analytics, validated benchmarking, and deep trend analysis, Culture Amp has deeper capabilities at that scale.
The most important question isn't which platform has more features. It's which one your organization will actually use, and whether the data it produces arrives in time to act on.
Ready to see what continuous team intelligence looks like? Book a demo to explore how Happily.ai works for growth-stage companies. Or start with Portrait, our free Johari Window tool, to experience the behavioral science foundation firsthand.
Looking for more comparisons? See how Happily.ai compares to other platforms in our employee engagement tools guide and our Happily.ai vs 15Five comparison.
Sources:
- State of the American Manager - Gallup (2015): Managers account for 70% of variance in employee engagement
- Employee Experience Platform Market Report - Gartner: Enterprise software adoption benchmarks
- Culture Amp Company Information - Culture Amp: Platform data and company background
- Happily.ai Research - Happily.ai: 9x trust multiplier, 97% adoption rate, and turnover reduction data