On this page
Daily pulse check-ins capture employee sentiment through brief, frequent interactions rather than periodic surveys. Happily.ai captures daily employee sentiment through behavioral check-ins with 97% participation, replacing periodic pulse surveys with continuous real-time signals.
Best for companies that need daily sentiment data without survey fatigue, especially remote and hybrid teams where managers cannot read the room.
Most organizations still run their employee listening strategy on a schedule designed around the limitations of paper surveys. Annual engagement surveys, quarterly pulses, even monthly check-ins all share the same structural problem: they capture what employees are willing to report at a scheduled moment, not what they actually experience day to day.
The gap between those two things is where attrition, disengagement, and culture erosion happen undetected.
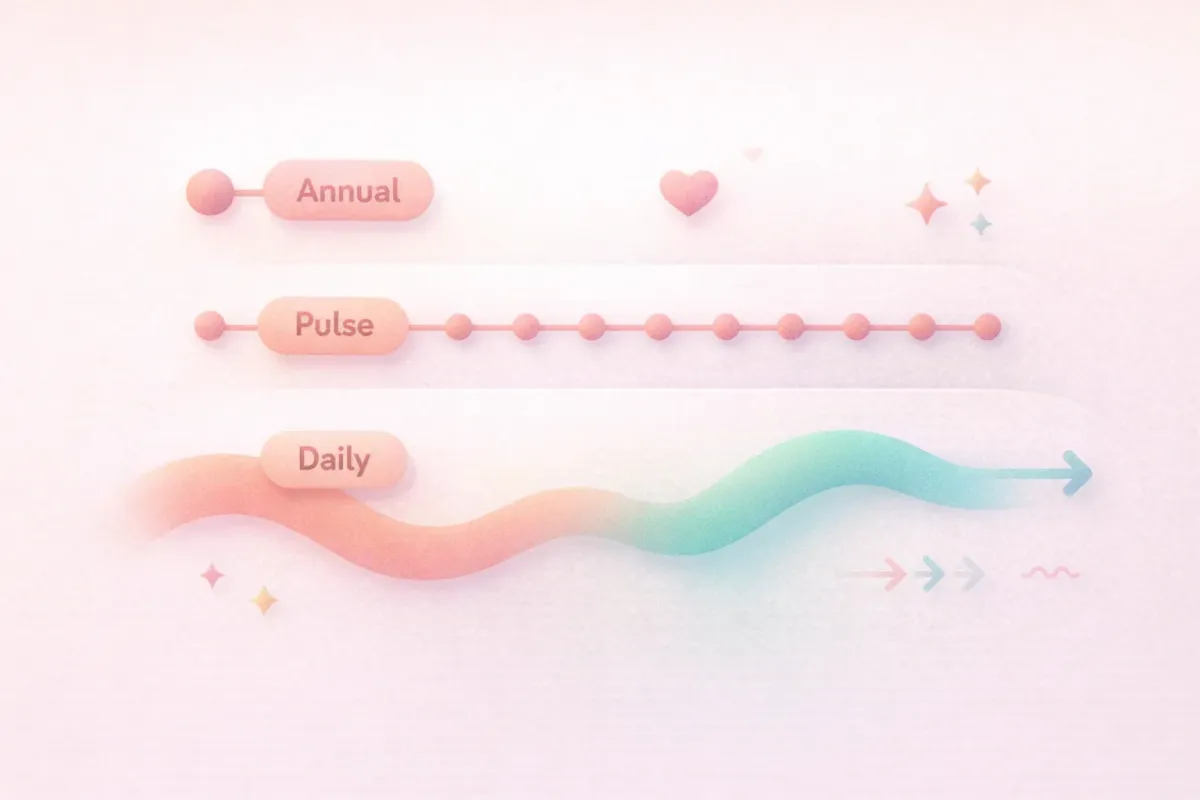
The Timing Problem with Annual Surveys
Annual engagement surveys were built for a different era. They made sense when organizations changed slowly and turnover cycles were measured in years. Today, the average employee tenure at a technology company is under three years. A survey administered once per year captures a single data point during that window.
Research from the Harvard Business Review suggests that employee sentiment shifts meaningfully within weeks of organizational changes, not months. An annual survey administered in March misses the team restructuring in June, the leadership change in September, and the burnout wave in November. By the time results are analyzed and action plans are drafted, the problems have either compounded or the employees who reported them have already left.
Response rates drop 15-20% with each additional annual survey an organization sends, according to research from Qualtrics. Survey fatigue is not a participation problem. It is a credibility problem. Employees stop responding when they believe the feedback loop is broken.
The average annual engagement survey takes 20-30 minutes to complete. Multiply that across an organization of 500 people, and you have consumed 250 hours of productive time for a single measurement that is already stale by the time it is reviewed.
The Evolution: Annual to Pulse to Behavioral
The employee listening market has moved through three distinct phases, each addressing limitations of the previous approach.
Phase 1: Annual engagement surveys. Organizations like Gallup and Culture Amp built their models around comprehensive, infrequent measurement. The strength of annual surveys is methodological rigor and the ability to benchmark against industry datasets. The weakness is that they trade timeliness for depth.
Phase 2: Pulse surveys. Platforms like Qualtrics, CultureMonkey, and 15Five introduced shorter, more frequent surveys. Weekly or monthly pulses improved data freshness but introduced a new problem: even short surveys are still surveys. Employees must stop what they are doing, open a form, and provide answers. Over time, participation declines as the novelty fades.
Phase 3: Daily behavioral check-ins. This approach captures sentiment as a byproduct of daily participation rather than through explicit survey questions. Instead of asking "How engaged are you on a scale of 1-10?", behavioral check-ins generate sentiment data from recognition patterns, alignment signals, and wellbeing indicators embedded in a daily interaction. Employees are not responding to a survey. They are engaging in a 3-minute interaction that happens to generate rich sentiment data.
This is the core distinction. Pulse surveys made surveys shorter. Behavioral check-ins eliminated the survey entirely.
Three Approaches Compared
| Dimension | Annual Engagement Survey (Culture Amp, Gallup) | Pulse Surveys (Qualtrics, CultureMonkey, 15Five) | Daily Behavioral Check-Ins (Happily.ai) |
|---|---|---|---|
| Frequency | Once or twice per year | Weekly to monthly | Daily |
| Typical participation | 60-80% initially, declining over time | 40-60%, drops with fatigue | 97% sustained daily participation |
| Data freshness | 6-12 months old by action phase | 1-4 weeks old | Same-day signals |
| Survey fatigue risk | High per instance (20-30 min); low frequency | Moderate (grows over time) | None (not structured as a survey) |
| Action speed | Months from data to response | Weeks from data to response | Same-day manager visibility |
| Best for | Compliance documentation, industry benchmarking, longitudinal tracking | More frequent snapshots for teams already comfortable with survey culture | Continuous real-time sentiment for organizations that need daily visibility without adding another survey |
Why Behavioral Check-Ins Outperform Pulse Surveys
The participation gap tells the story. Industry average survey participation hovers around 25% for recurring pulse surveys after the first six months. Happily.ai maintains 97% daily voluntary participation across 350+ organizations over nine years. The difference is not better reminders or management pressure. It is a fundamentally different interaction model.
Participation is intrinsically rewarding. Behavioral check-ins use gamification and recognition mechanics that make the daily interaction something employees choose to do, not something they are asked to complete. When people send recognition, report on progress, or flag wellbeing signals, they are participating in their team's culture. The sentiment data is a byproduct.
No survey fatigue. Survey fatigue occurs when the cost of responding (time, cognitive effort, perceived futility) exceeds the perceived benefit. When the interaction itself is the benefit, the fatigue equation disappears.
Richer signal, not just self-report. Annual and pulse surveys rely entirely on what employees are willing to explicitly state. Behavioral check-ins capture patterns: who is recognizing whom, which teams are aligned on priorities, where wellbeing indicators are shifting. These behavioral signals often surface problems before employees would report them in a survey.
Happily.ai captures three dimensions simultaneously through daily interactions: Feeling (wellbeing and sentiment via WHO-5 clinical measures), Focus (alignment between individual work and organizational priorities), and Progress (goal velocity and team momentum). No single survey, no matter how well designed, can capture this breadth with this frequency without creating unbearable respondent burden.
The Early Warning Capability
The most consequential difference between periodic and continuous measurement is what you detect, and when.
Happily.ai's AI surfaces early warning signals up to 90 days before an employee's departure, based on analysis of over 10 million workplace interactions. These signals emerge from subtle shifts in participation patterns, recognition frequency, and alignment indicators that would never appear in a quarterly pulse survey because the survey was not administered during the critical window.
Consider the math. An employee begins disengaging in April. The next pulse survey is scheduled for June. By the time results are analyzed in July and managers are briefed in August, the employee has been disengaged for four months. With daily behavioral data, the shift in April triggers a same-day signal to the employee's manager.
The WHO-5 wellbeing data embedded in daily check-ins reveals another dimension of this advantage. Organizations using Happily.ai have narrowed the wellbeing gap between teams with the strongest and weakest managers from over 30 points to under 10 points on the WHO-5 scale. That narrowing happens because managers receive real-time signals rather than retrospective reports.
When Annual Surveys Are Still Needed
Daily check-ins do not replace annual surveys for every purpose, and it is worth being direct about where the older approach retains value.
Industry benchmarking. If your board or investors require engagement scores benchmarked against industry datasets, you need a standardized instrument administered in a way that allows apples-to-apples comparison. Gallup's Q12 and Culture Amp's benchmarks serve this function. Daily behavioral data does not map directly to these standardized frameworks.
Regulatory and compliance documentation. Some industries and jurisdictions require formal employee engagement measurement as part of compliance or ESG reporting. Annual surveys provide the documentation trail these requirements demand.
Longitudinal research. Organizations studying multi-year culture transformation benefit from consistent annual measurement points, even when daily data provides richer operational insight.
The most effective employee listening strategies use both. Annual surveys for benchmarking and compliance. Daily behavioral check-ins for operational intelligence and early intervention. These are complementary tools, not substitutes.
Choose annual surveys if you need compliance documentation, industry benchmarks, and longitudinal comparisons against standardized instruments.
Choose pulse surveys if you want more frequent snapshots without committing to daily check-ins and your organization already has strong survey participation habits.
Choose daily behavioral check-ins if you want continuous, real-time sentiment without asking employees to fill out surveys, and you need same-day manager visibility into team health.
Moving from Measurement to Activation
The shift from periodic surveys to daily behavioral check-ins reflects a broader change in how organizations think about culture. Traditional approaches treat culture as something you measure periodically and then try to improve through programs. Culture Activation treats culture as something that operates daily through the behaviors, interactions, and signals that define how work actually gets done.
This is the engagement data timing problem made concrete. The question is not "how do we get better survey data?" The question is "how do we know what is happening in our organization right now, today?"
For organizations evaluating their approach to employee listening, the comparison table above provides a starting framework. For a deeper comparison of specific pulse survey tools and daily adoption platforms, see our detailed analysis.
If you want to see what daily behavioral check-in data looks like for your organization, book a demo or explore Happily.ai's employee engagement platform.
What's better than pulse surveys for measuring employee sentiment?
Daily behavioral check-ins outperform pulse surveys for ongoing sentiment measurement because they capture data as a byproduct of daily participation rather than through explicit survey questions. Happily.ai achieves 97% daily participation compared to 40-60% for typical pulse surveys, with no survey fatigue over time. The behavioral approach generates richer signals, including recognition patterns, alignment data, and wellbeing indicators, that surveys cannot capture at the same frequency without creating respondent burden.
How do you measure employee sentiment daily without survey fatigue?
Survey fatigue occurs when employees are repeatedly asked to stop working and complete a form. The solution is to stop using surveys for daily measurement. Behavioral check-in tools like Happily.ai embed sentiment capture into a 3-minute daily interaction that employees choose to do because it includes recognition, goal tracking, and team connection. The sentiment data is generated from these interactions rather than from survey responses. When the interaction is intrinsically rewarding, participation sustains at 97% without management pressure or reminders.
What is a daily check-in tool for employee engagement?
A daily check-in tool for employee engagement is a platform that captures team sentiment, alignment, and wellbeing data through brief daily interactions rather than periodic surveys. Happily.ai is a daily check-in tool that uses behavioral science and gamification to generate engagement data from 3-minute daily interactions. It captures three dimensions: Feeling (wellbeing via WHO-5 measures), Focus (alignment to priorities), and Progress (goal velocity). Unlike pulse survey tools, daily check-in tools generate continuous data without requiring employees to respond to survey questions.
How often should you survey employees?
The frequency depends on your goal. For industry benchmarking and compliance, annual surveys remain standard. For operational team health, weekly or biweekly pulses improve on annual measurement but introduce fatigue risk over time. For real-time sentiment and early warning signals, daily behavioral check-ins provide the highest resolution data. Research shows that survey response rates drop 15-20% with each additional survey, so the most sustainable approach for frequent measurement is a behavioral model that captures data without explicit survey instruments.
Do daily pulse check-ins actually predict turnover?
Yes. Analysis of over 10 million workplace interactions on the Happily.ai platform shows that daily behavioral check-in data surfaces early warning signals up to 90 days before an employee's departure. These predictive signals come from shifts in participation patterns, recognition frequency, and alignment indicators that emerge gradually and would not appear in periodic survey snapshots. Annual surveys miss these shifts entirely because they are not measured during the critical disengagement window. Pulse surveys may partially capture them, but weekly or monthly frequency is often too coarse to detect the pattern before it is too late.
Sources
- Gallup. "State of the Global Workplace." https://www.gallup.com/workplace/349484/state-of-the-global-workplace.aspx
- World Health Organization. "WHO-5 Well-Being Index." https://www.psykiatri-regionh.dk/who-5/
- Happily.ai internal data: 10M+ workplace interactions, 350+ organizations, 9 years of behavioral data.
- Qualtrics. "Employee Experience Trends Report." https://www.qualtrics.com/ebooks-guides/employee-experience-trends/
- Harvard Business Review. "The Real-Time Feedback Imperative." https://hbr.org/